busy airport
With news that up to 40 US airports are likely to see flight reductions, expect some panicked news reports. These reports are going to cause travel chaos—the political class benefits from this, on both sides.
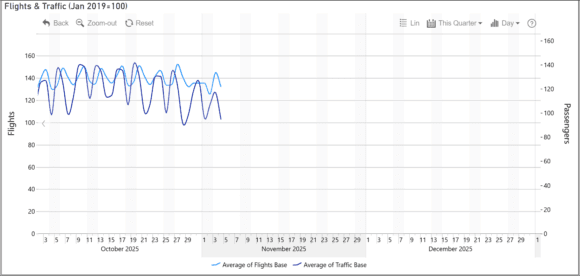
What does the data show? The following chart lists flights and traffic. We use January 2019 as our base. If the curve is over 100, then there’s been growth since that base period.

The shutdown started on October 1, 2025. The number of flights shows a steady swing over the period through November 4. Passenger traffic shows wider swings, and the trend looks softer as we go through October.
The following chart shows the same information from another perspective: November flights have seen a decline in load factor.

But the key item isn’t traffic, it’s the number of flights. The FAA’s ATC problem is its rising inability to handle the number of flights.

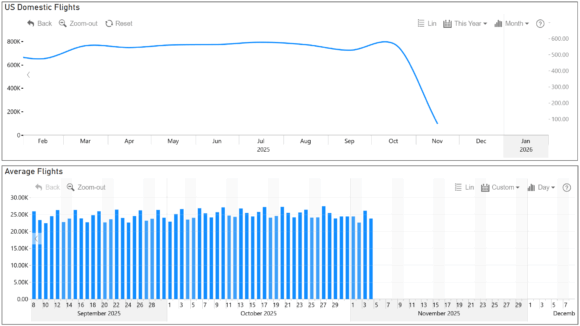
The upper chart shows a steep decline in November, driven by three reporting days. The lower diagram shows the trend better – the US domestic market has looked relatively stable. The market operates ~25,000 flights daily.
The charts do not show what delays look like, and there have been plenty of those. So, is the FAA threat a problem? For sure, but we are not seeing anything signalling that. Yet.
Views: 136


