How Upgauging Math Reshapes US Airline Fleets
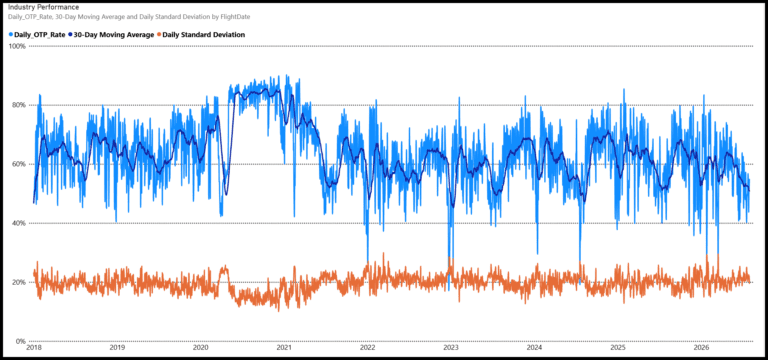
This chart shows aviation performance from 2018 to 2026, tracking daily OTP for US airlines and its smoothed moving average. The implications for US airlines are interesting.

This chart shows aviation performance from 2018 to 2026, tracking daily OTP for US airlines and its smoothed moving average. The implications for US airlines are interesting.
The US DOT T-100 datasets have been updated through June 2026. This update allows us to adjust our models to parse the metrics and KPIs we have been developing. Given our shift away from news and toward data and analysis,…


Its been some time since we last shared this data model. Using the US DOT’s T-2 dataset, we developed this simple model that provides a glimpse into the industry’s airlines and how they perform operationally. The data is current through…

