
immigration line
Fresh August I-92 data reveals how US international air traffic is shaping up — with stable flows overall but regional differences driven by exchange rates and airline strategies.
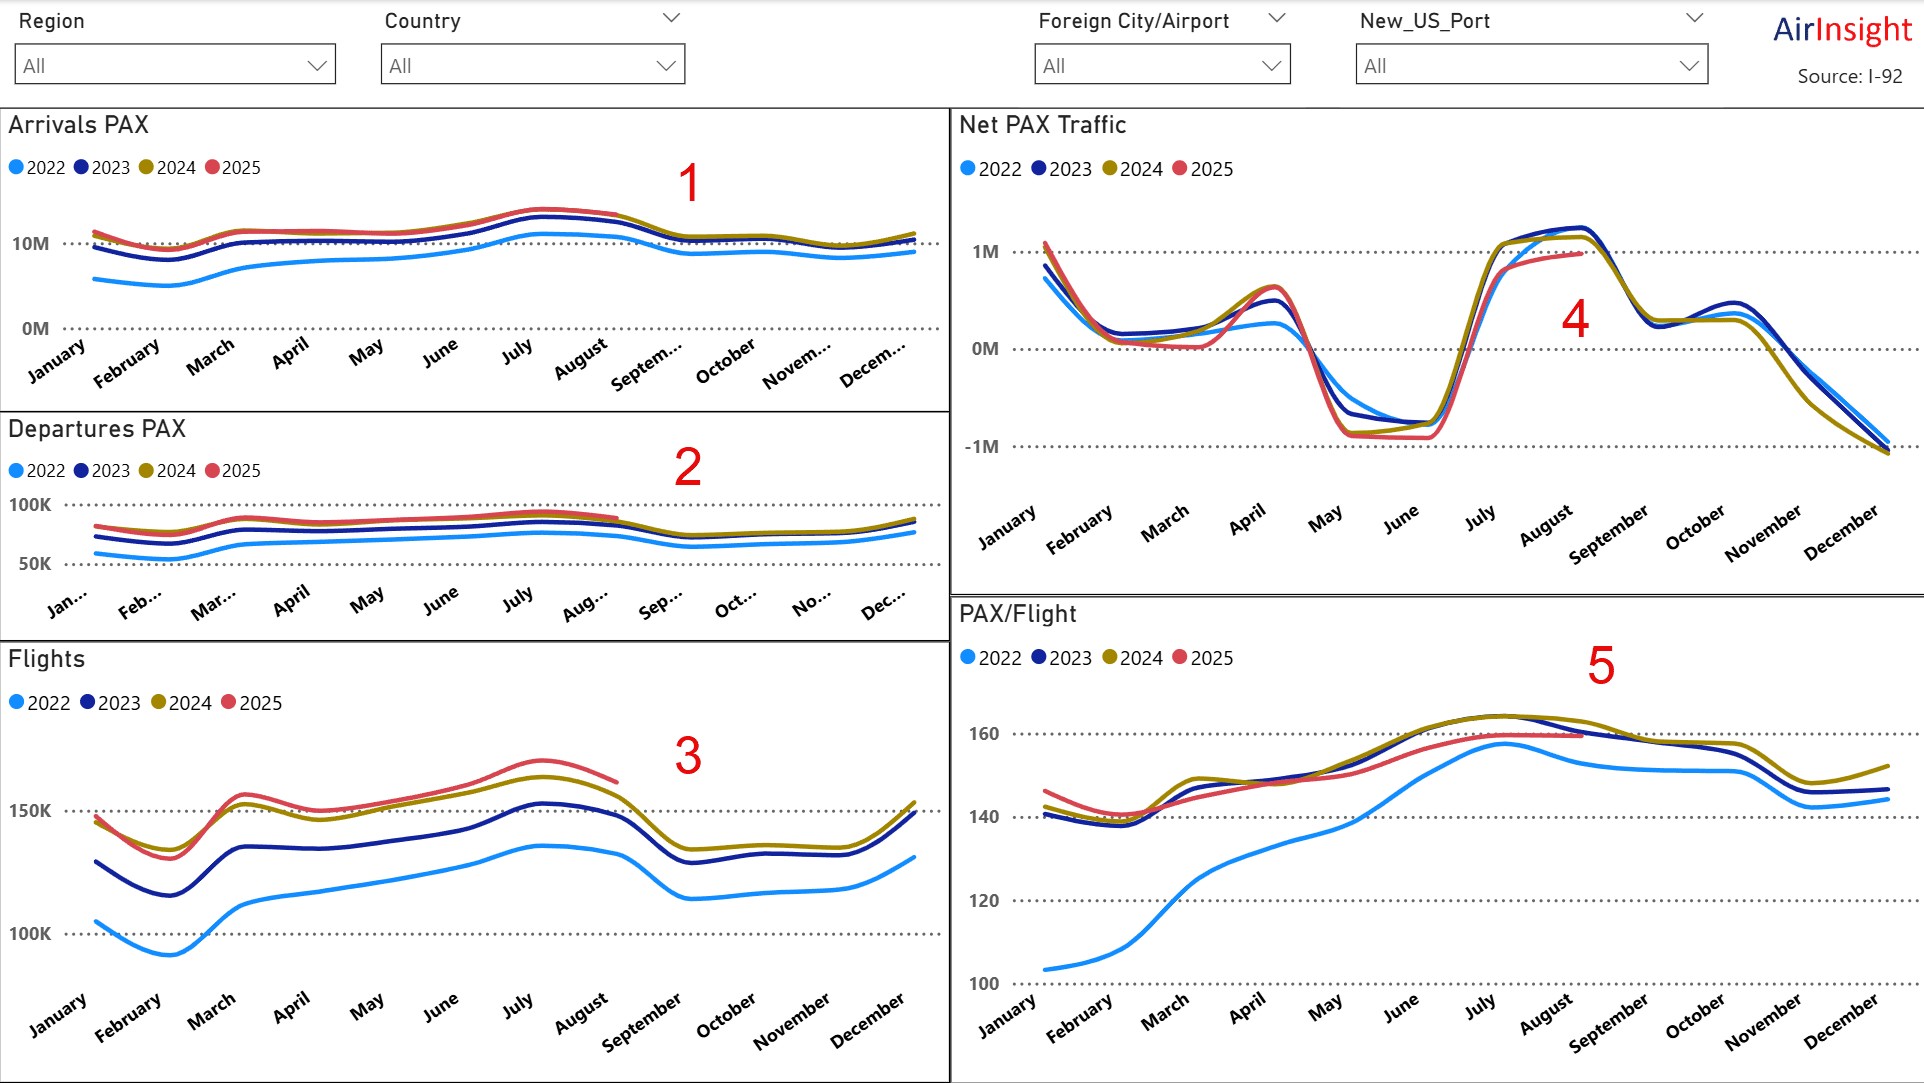
This is a busy chart, so we break down the items by number.
- Overall arrivals look pretty stable compared to last year. And the trend has been consistent all through 2025.
- Departures match arrivals closely. Again, nothing radical.
- 2025 is seeing a rise in the number of flights. Not what you’d expect if the tariff sky is falling. Airlines seem quite bullish, wouldn’t you think?
- Net traffic is the difference between arrivals and departures. 2025 is following the previous years’ pattern. August 2025 is somewhat lower than in previous years. Is this driven more by exchange rates?
- This chart, along with chart 3, suggests that airlines may be operating more flights, possibly using smaller aircraft.
Canada
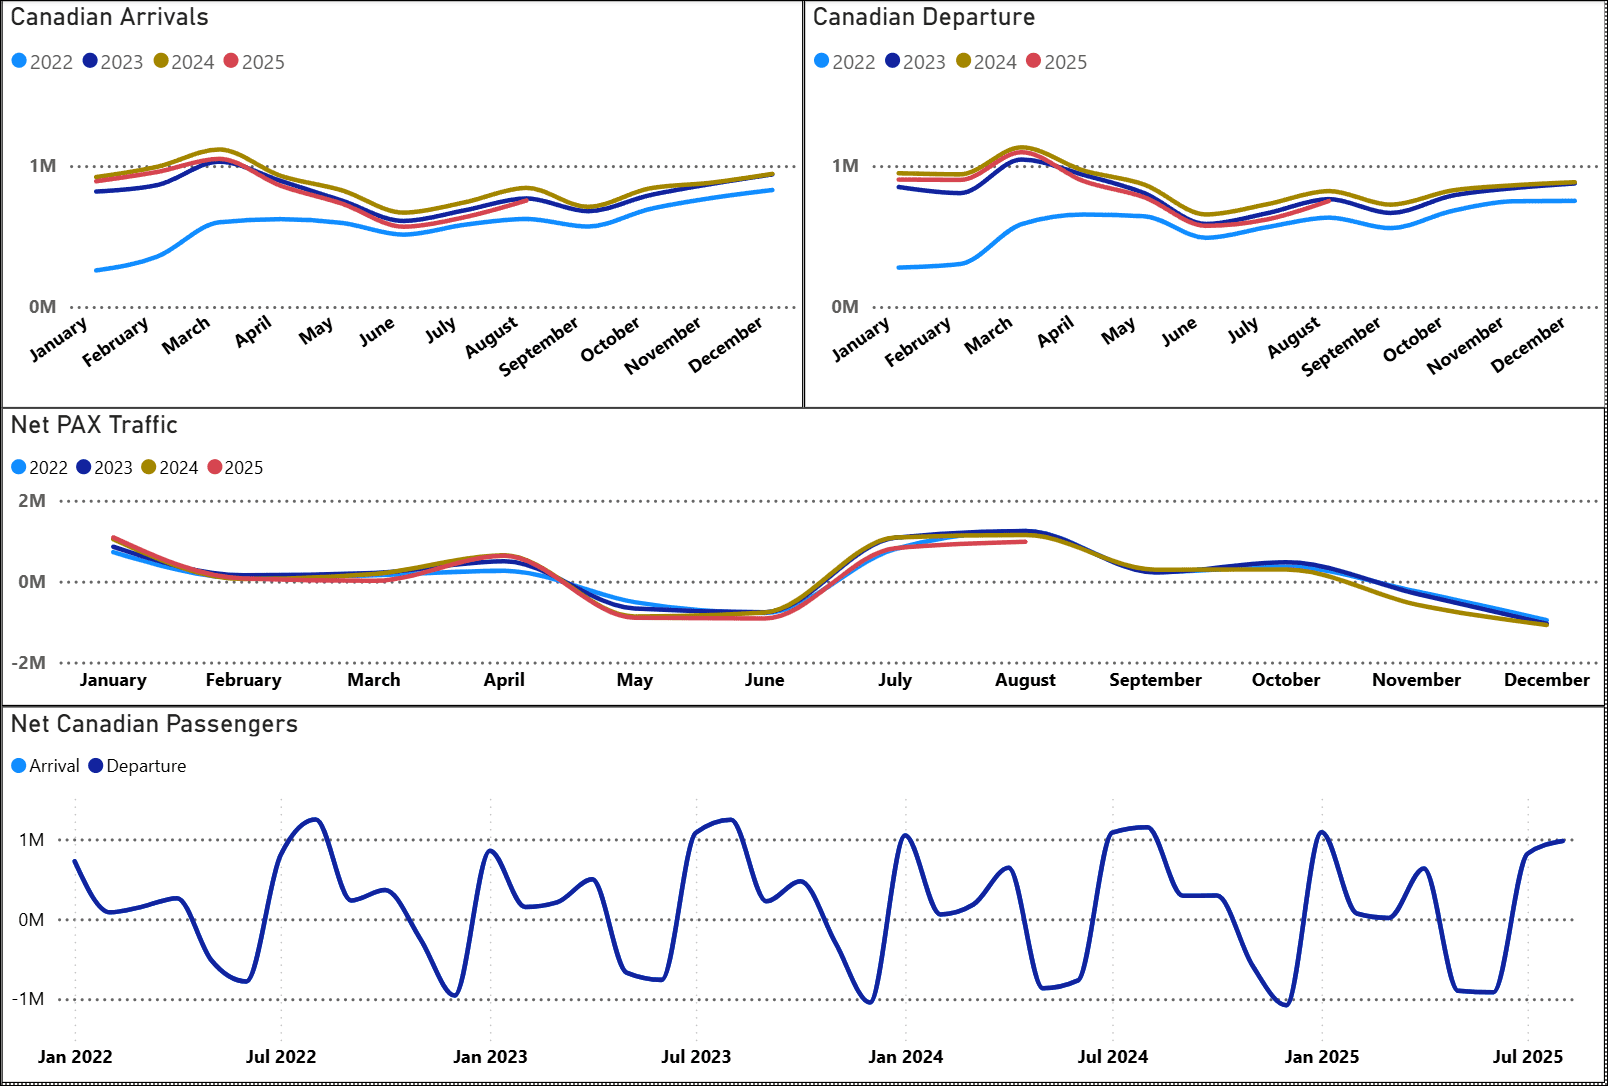
In previous reports, we noted that Canada was the market with the most significant decline. Here are the charts.
Yes, Canadian air traffic is down compared to previous years. It could be politics. But there are two other items; most Canadians don’t fly to the USA, they drive. Secondly, here’s a five-year history of the exchange rates. The Loonie isn’t going as far as it used to.
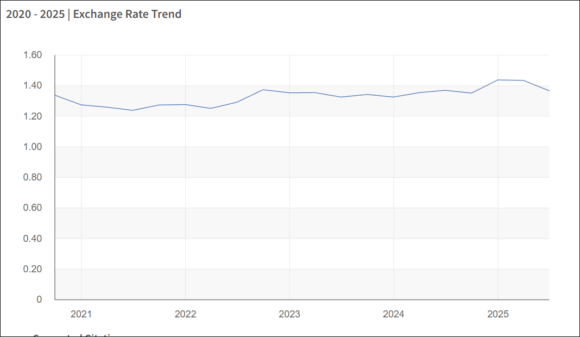
Canada’s EDC offers this interesting reflection and outlook. This source confirms that the weaker Canadian dollar has an impact. Germany appears to be the leading EU-based market.
Europe
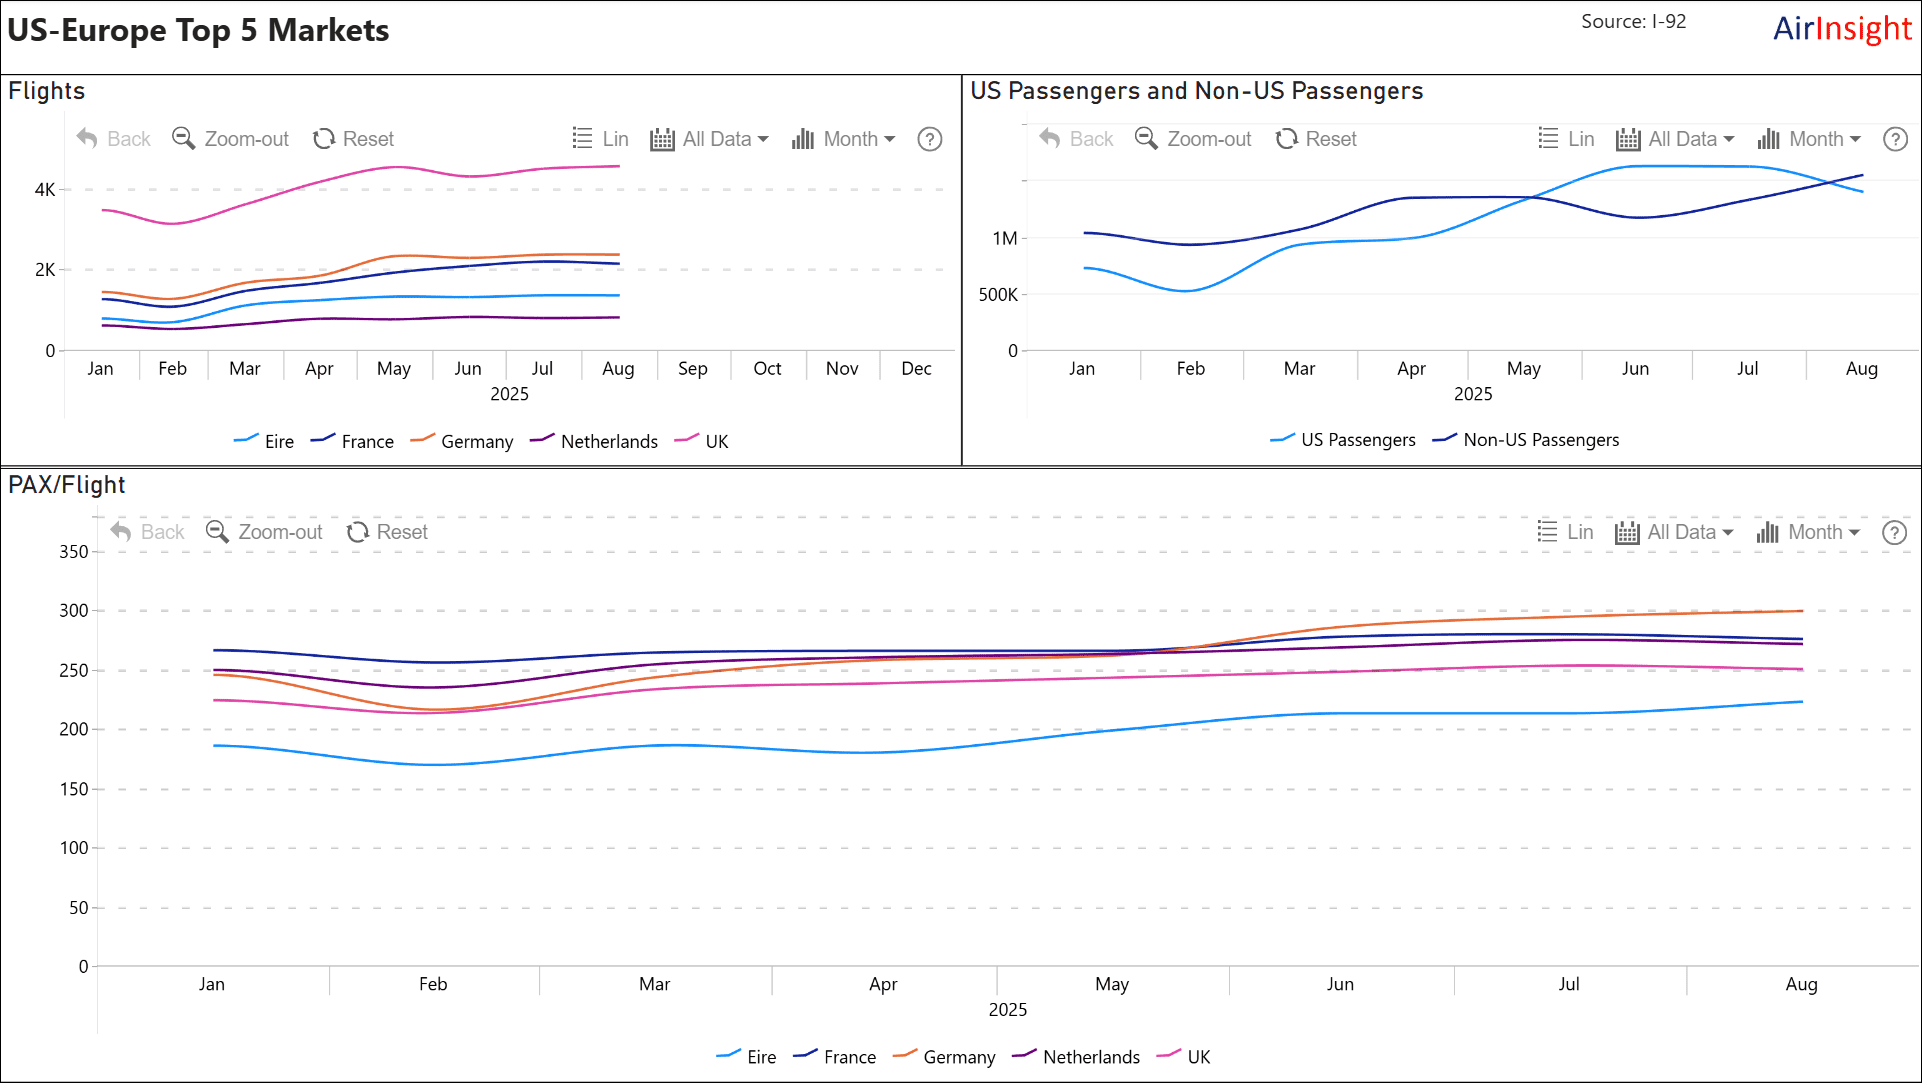
Another key market for the United States air traffic is Europe. Here’s the chart.
The number of flights looks stable in 2025. Overseas visitor volumes slowed during the summer, but the trend is still up YTD.
Asia
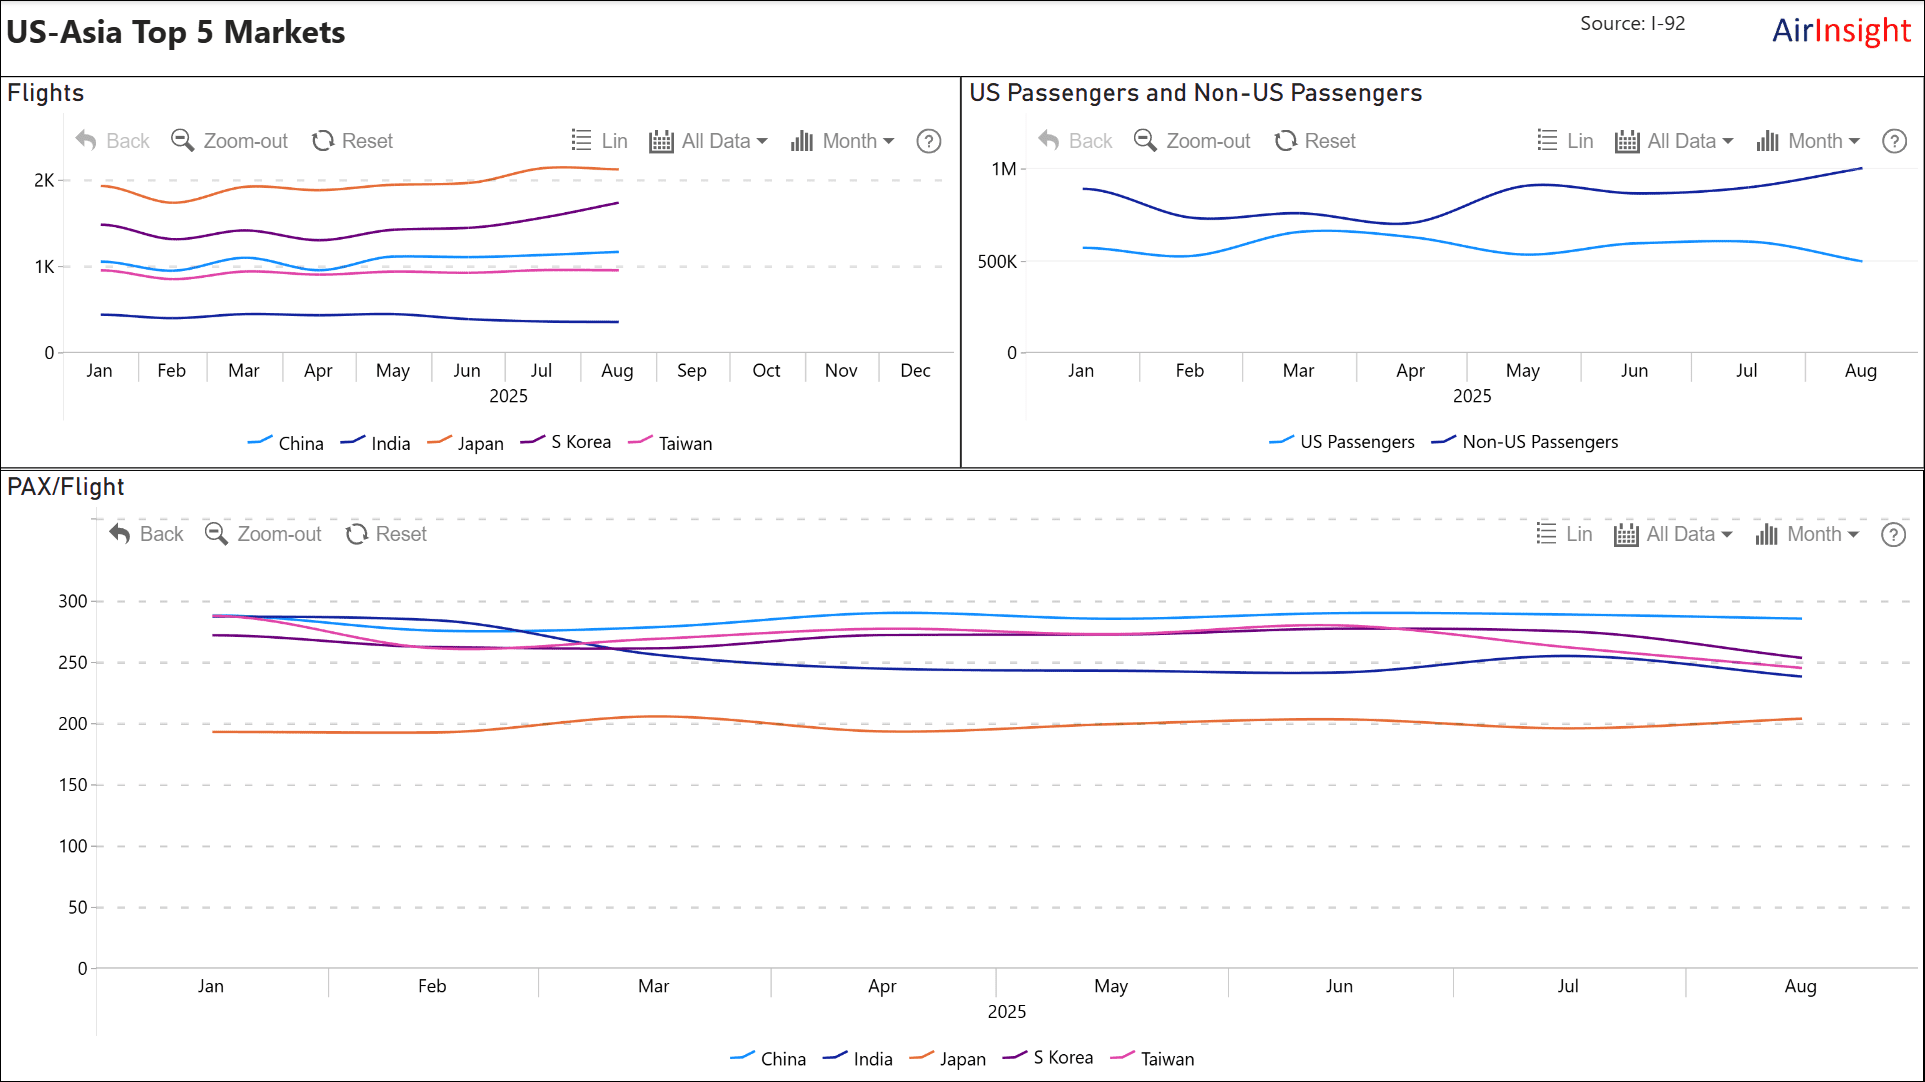
Here’s the August chart for Asia. In our July report, we noted that Asia seemed to have a low impact YTD. The August data suggest this trend continues. The top five markets look steady.
Latin America
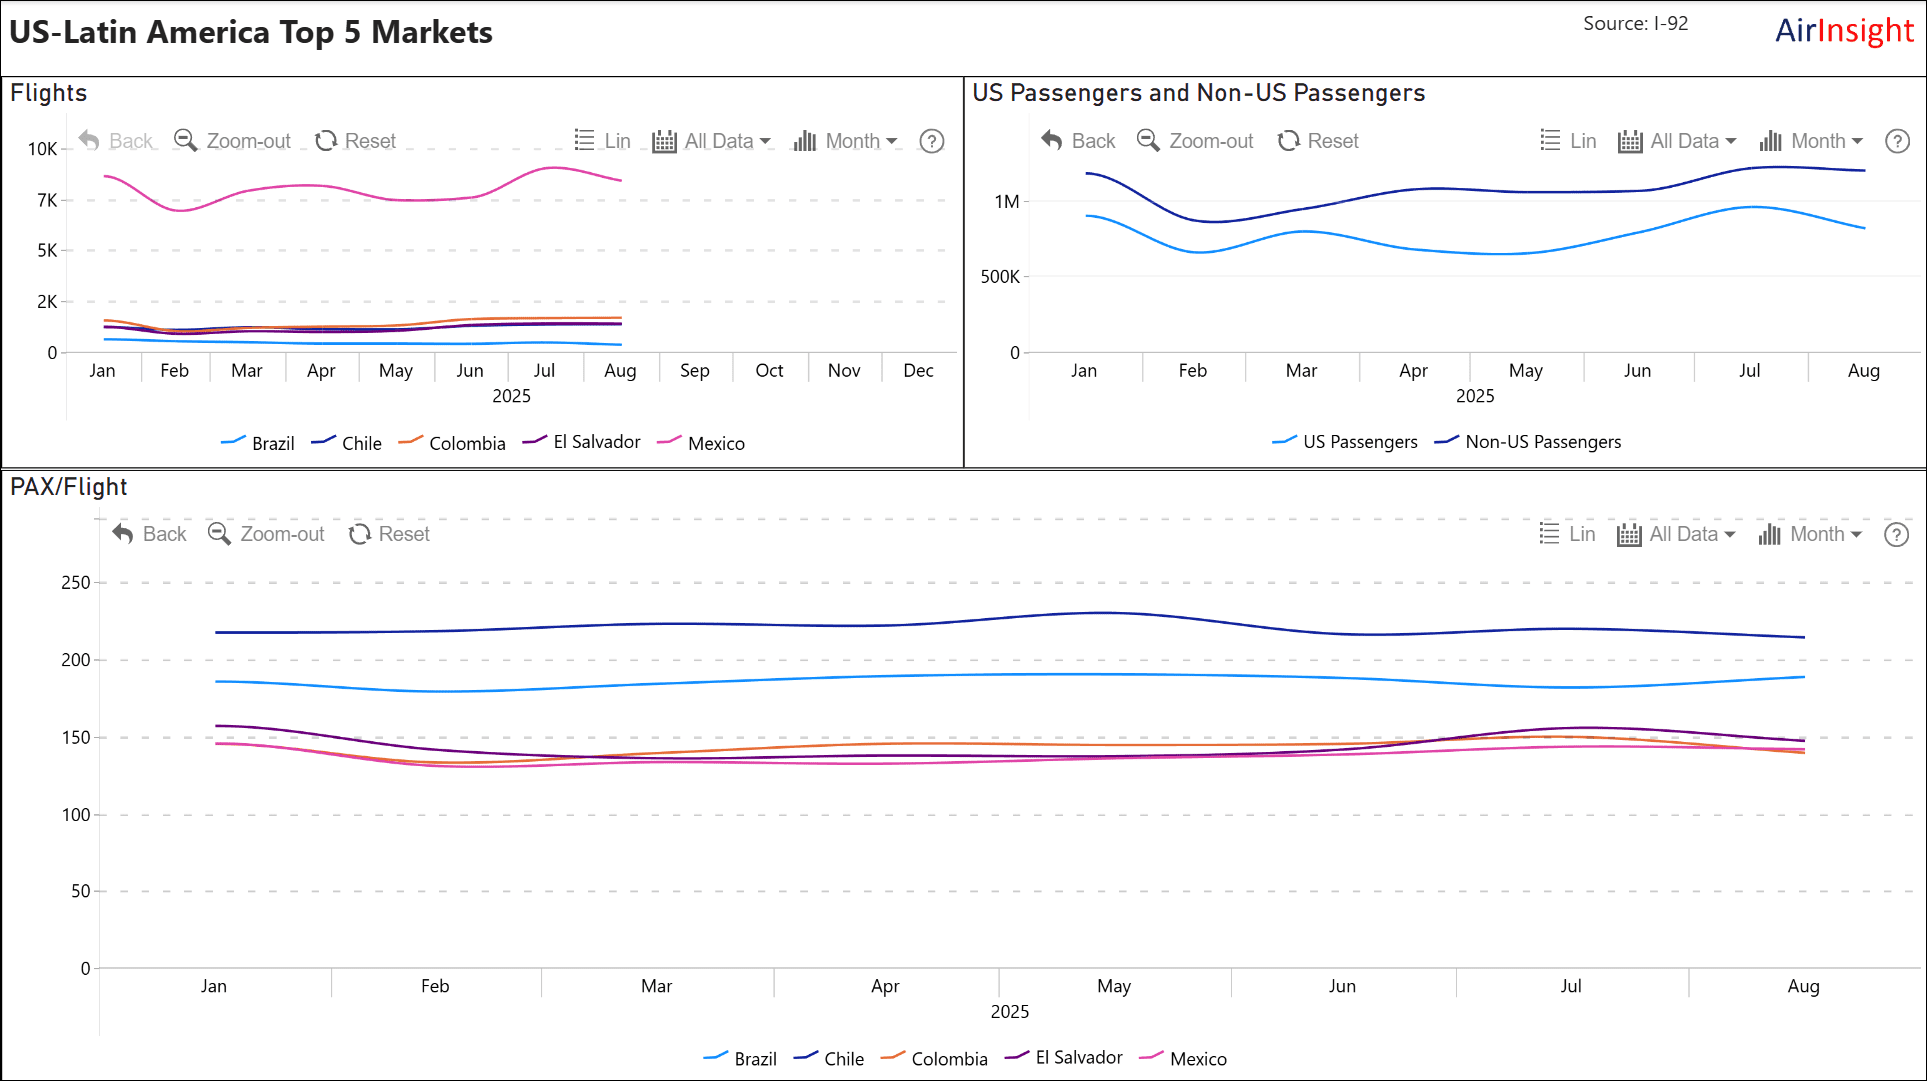
Here’s the chart for this region. By now, you’re expecting to see a similar trend to the other key markets. And that is indeed the case. Mexico, like Canada, is primarily a drive market. Traffic looks stable and consistent—more arrivals than departures. It seems steady as she goes.
Summary
There’s a lot of data to digest, so let’s summarize it. Inbound travel is down a bit from last year. August saw possibly the smallest YTD monthly decline.
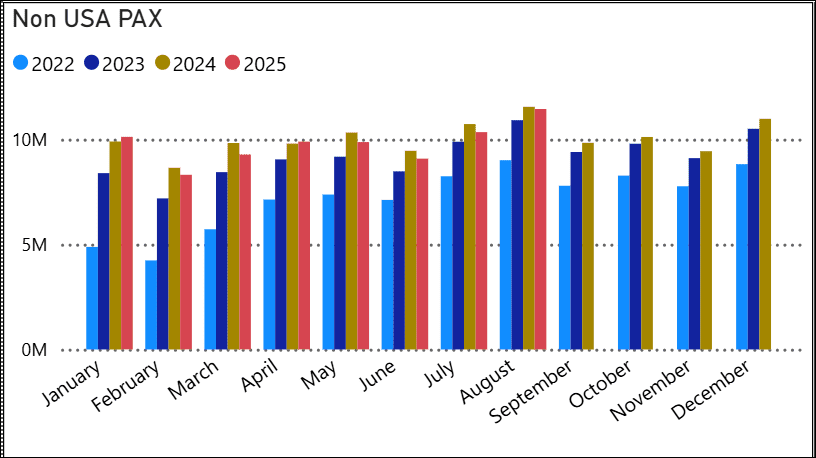
As the Canadian analysis reports, there is uncertainty because of US tariffs. The Conference Board echoes this uncertainty.
However, the sentiment from four months ago may be overstated. The US International Trade Administration forecast states: “Total international arrivals will continue to increase solidly over the next three years and will surpass pre-pandemic 2019 visitation in 2026. According to the forecast, total international arrivals will increase 6.5% to 77.1 million in 2025, rise 10.2% to 85 million in 2026, and grow 6% to 90.1 million in 2027.”
Views: 130
About The Author
Take AirInsight for a Test Flight
7 days full access — premium analysis and the complete data model library — for $1. No commitment.
Start My Test Flight →

