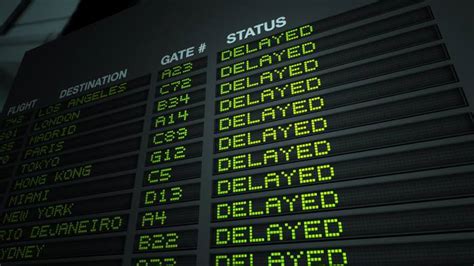
delayed
Utilizing the US DoT’s On-Time dataset allows a fascinating look at how US airlines perform against published schedules. After all, it’s the schedule they sell at 100c on the dollar. Should you expect to get what you pay for?
The model has three pages.
- On the first page, select a city pair and see how each airline performs. This helps you consider what your time is worth when choosing an airline for this route.
- This page provides an overview of the airlines’ arrival delay times. Generally, the later in the day you fly, the more likely you will arrive late.
- Here, you see the average arrival delays by each airline for the system performance. We also offer a table showing the percentage of flights arriving 15 minutes or later. The 15-minute benchmark is what the DoT considers late.
Views: 53


