2019 08 21 17 29 59
The US DoT’s On-Time database is a great place to mine for information on how effective airlines are at managing their business. After all, the core of what airline’s sell is their schedule. Airlines require customers pay 100 cents on the dollar for something listed on the schedule. But airlines have an amazing amount of ways to escape their obligation to deliver what they sold. No other business can get away with this.
As we have explained elsewhere, the typical minute airline is worth about $80. But how many minutes do airlines simply “lose” because of the plethora of things that impact their business? As usual, we went into the data to find out. Well executed flight ops are critical to making an airline successful and profitable.
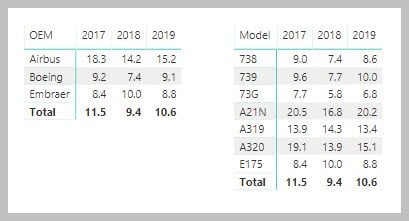
Starting off, here’s the Airbus fleet in the United States. We list the average of Arrival Delay Minutes.
The A220-100 seems to be having some challenges. This fleet is currently all Deltaand they are surely working through the learning curve. As we can see Delta has done well with their A350-900s, with a significant improvement showing up already.
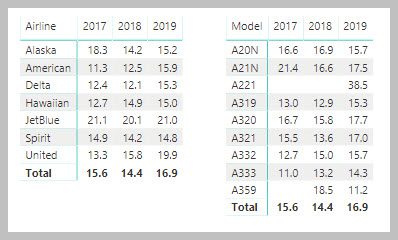
Looking at an airline example, Alaska in this case, we can see how they are doing. Again the numbers are Arrival Delay Minutes.
It appears Alaska is having trouble with their Airbus fleet compared to the Boeing fleet. Especially with their A321neos.
Our model goes deeper into the data and lists the tail numbers to identify serial delayed members of the fleet. Subscribers can drive the model from here. The model is listed as On-Time Fleet Tracker.
Views: 11


