2019 05 31 12 54 43
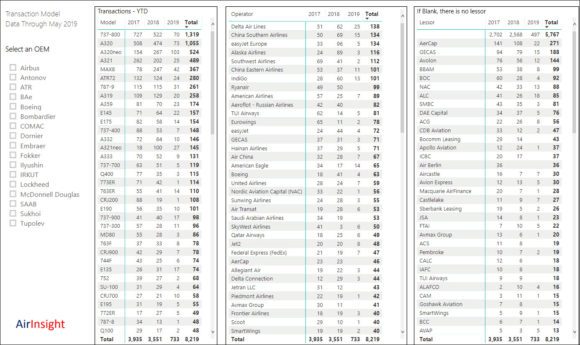
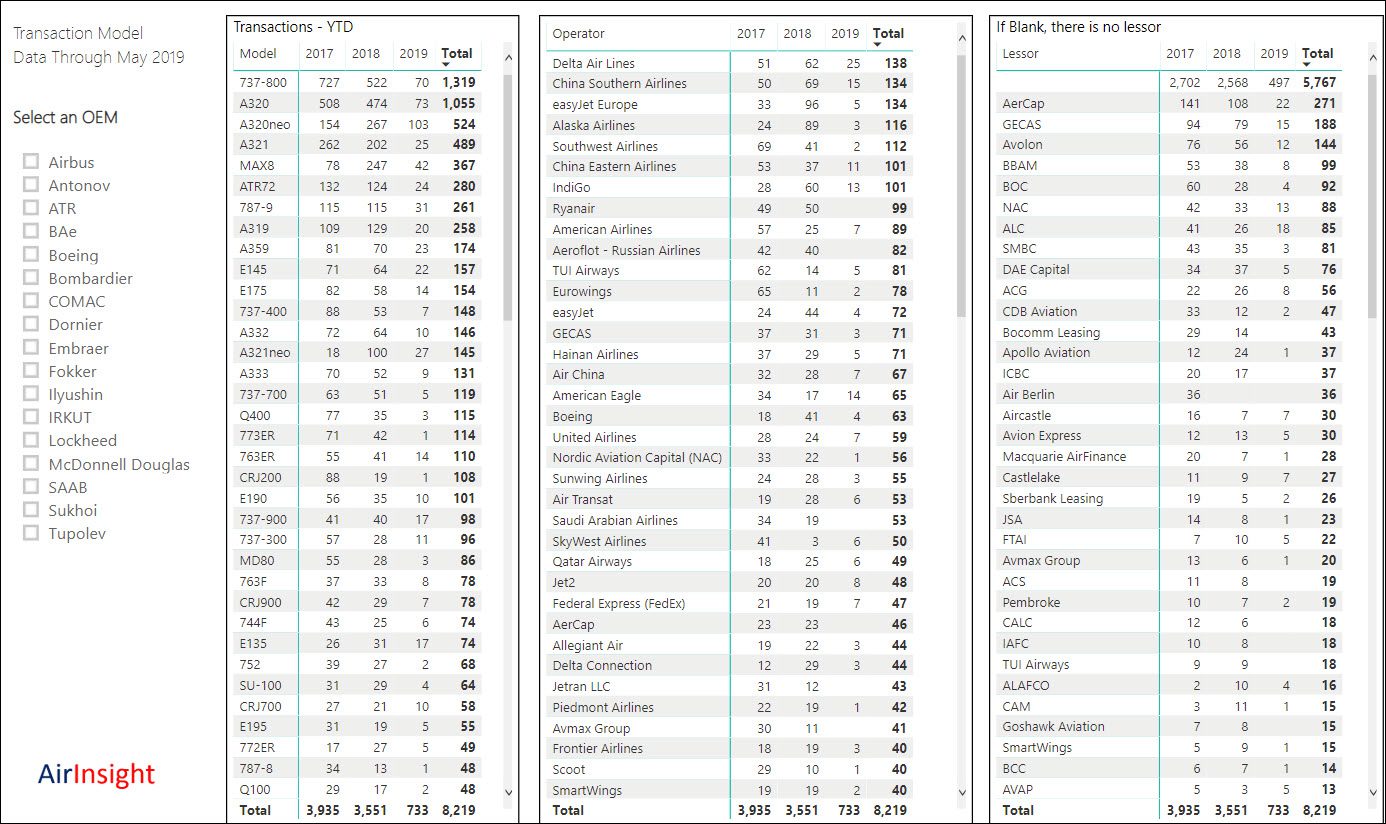
We have updated our transactions tracker and switched from PowerPoint charts to a dynamic model. This model will be open to all readers. We plan to update the model after each month end.
Page one: select an OEM and watch the tables change. The tables are in descending order. On the Lessor table notice that the first row is blank. That means the transactions in that row did not have a lessor attached.
Page two: Select a year and see how the tree chart changes. The top of each “leaf” has the model name and the lower number in the same “leaf” shows the number of transactions. Mouse over any leaf to see details. What we noticed is the number of older models that are still trading, i.e. the E170 and Q100. The chart shows how closely the A320ceo and 737-800 compete. Also, when looking at 2019, notice the jump in A320neo transactions. The grounding of the MAX has had a staggering impact at the worst possible time.
If you have any suggestions of what you want to be added to the model to provide additional insight, please use the comment section below.
Please click on the image to load the model.
Views: 42

