In recognition of the times, we are opening a subscriber model to our general audience. Regular readers have seen our charts showing the damage the industry is undergoing. The human cost is high and likely to rise – something that everyone in the industry appreciates and feels deeply. Commercial aviation is truly special. The people in the industry share a mutual passion for the technologies and equipment that allow millions of people (and tons of cargo) to fly across vast distances.
Industry people also share mutual respect, because this is a brutally competitive industry that suffers regular disruptions. We’ll say it again – this is a special industry.
Trying to understand what the industry is going through we assembled metrics that focus on data – not people. The first page offers a summary. The second page offers the T-2 data allowing you to select an airline, aircraft type, or family to drill down. The average revenue air hours per flight table shows how the industry functions – it has a rhythm and is consistent. It is a business model that does not like shocks but gets them regularly anyway. Page three uses the T-100 Domestic Segment data source to illustrate steady growth in flights and passengers. The average passenger per flight table shows the dramatic drop off from the pandemic. This decline helps put the scale of the damage into perspective. The fourth page uses Form 41 data to illustrate the financial history and expense breakdown.
Readers will ask what is the breakdown of flying ops costs? Here is that data from another Form 41 source, P5.2.
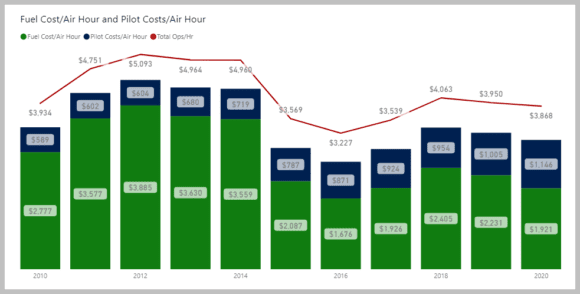
The chart illustrates the declining impact of fuel costs, driven by dropping oil prices and also by the fleet’s improving fuel efficiency. But what do the numbers look like? The next chart lays this out.
Pilots and fuel account for most of the flight cost. Better fuel burn and lower oil prices have most definitely helped the industry. Pilot costs rose as the pilot shortage started to bite. That was then.
These metrics provide readers with data and context to get a sense of how the US airline industry is trying the weather the pandemic – a shock like it has never faced before.


