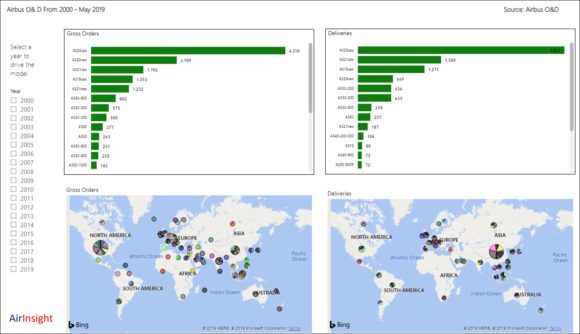
Here is our monthly model update. We have added more pages to the model to provide additional views on the data.
Page 1: Basic reporting of gross orders (Airbus won’t provide net) and deliveries (the more important number). This page also adds maps for both O&D. For each year the maps and charts change dynamically.
Page 2: Deliveries by airline. Select an airline to see what deliveries were made. Notice the major swing from A320ceo to A320neo underway. Similarly, note the rising demand for the A321.
Page 3: Looking at the backlog by airline and airline group. Select either a group or an airline.
Page 4: Only 2019 data, showing deliveries by the customer in descending order. No dynamics.
Page 5: Select a model from the pulldown menu. The chart updates accordingly.
If you have any feedback on the model or have any questions, please email us. You know what to do next.
Co-Founder AirInsight. My previous life includes stints at Shell South Africa, CIC Research, and PA Consulting. Got bitten by the aviation bug and ended up an Avgeek. Then the data bug got me, making me a curious Avgeek seeking data-driven logic. Also, I appreciate conversations with smart people from whom I learn so much. Summary: I am very fortunate to work with and converse with great people.


