6 26 2020 8 39 24 AM
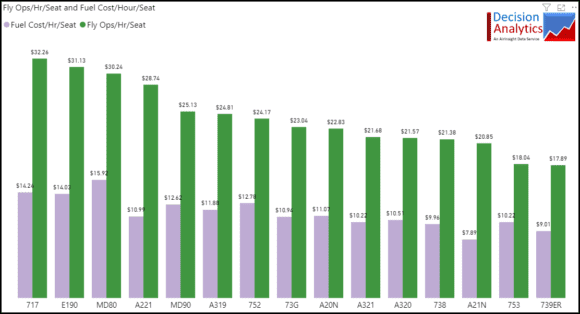
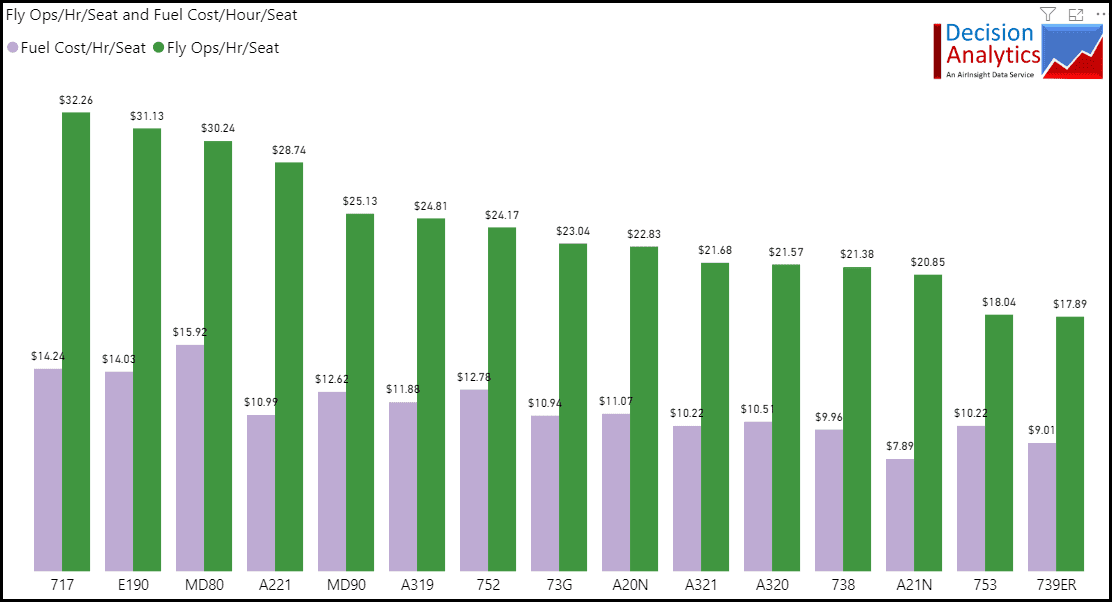
Given the paucity of good news from the commercial aviation industry, why not take a look at data for 1Q20? Here is a combination of data from the US DoT T-2 and Form41. This selection shows the US airline single-aisle airline fleet in terms of fuel burn/seat/hour and overall flight costs/seat/hour.
The data is sorted in descending order by flights ops costs. Some observations:
- The A220-100 has a low fuel burn, but overall is not that low cost to operate. It is exclusively (during the period) operated by Delta Air Lines. Are Delta’s other costs, specifically labor, an issue? When looking at Delta alone, the pattern remains as we see above. This could have interesting implications for major airlines operating the smaller jets between 100-130 seats. To wit, note the E-190 numbers.
- Boeing may have been on to something when they claimed the 737NG was competitive with the A320neo family. The data supports this. If we select one airline to take out variables (we selected Delta again), then the 737-900ER has 14.6% lower over operating costs than the A321. At Alaska, where both the NG and neo are in service, the 737-900ER is 14.9% better than the A321neo.
Looking forward to your comments.
Views: 25

