
busy airport
July is usually a great month for international visitors to the United States. The data this year shows interesting trends.
Airlines offered more flights in 2025 than in previous years. The chart illustrates this, with 2025 looking bullish from the airline industry’s view of the market.
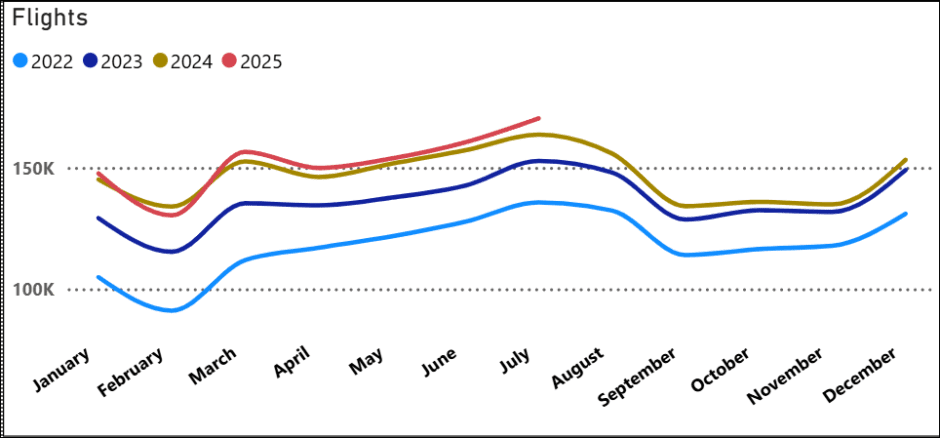
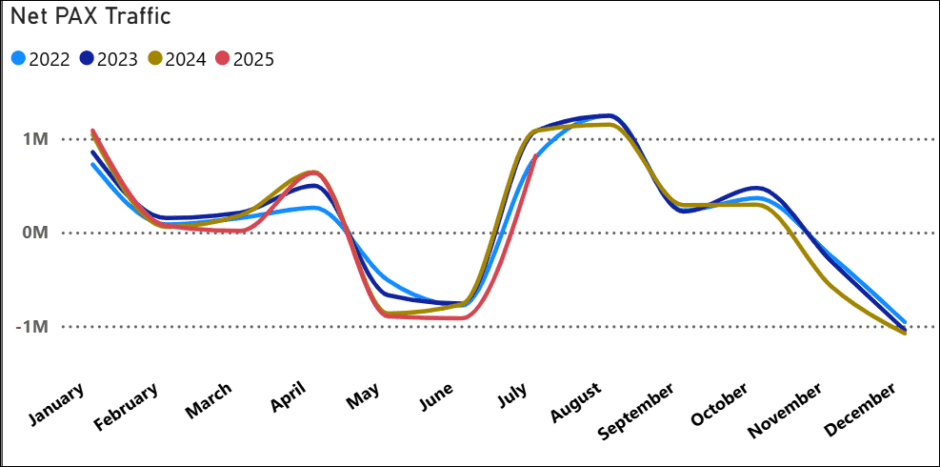
Traffic also bounced following the annual seasonal trend. But July 2025 is not where it was in 2024. This July looks equivalent to 2022.
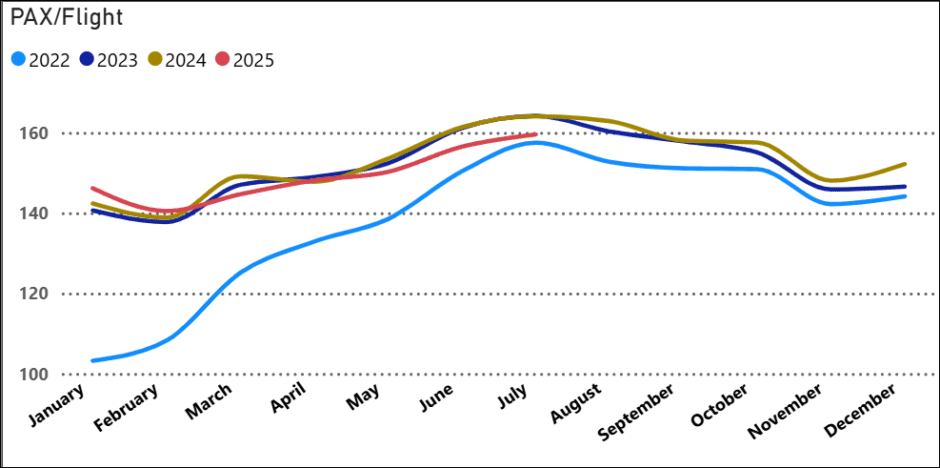
What could explain this? If we look at the number of passengers/flight, we see a possible answer. Notice there are fewer passengers per flight this year. The 2025 trend is distinctly lower than in previous years. Are airlines seeing lower factors, or are they flying smaller aircraft more frequently? Single-aisle deployments across the North Atlantic are growing, but are too small to impact these volumes. This impact is more likely to show in the markets to the south of the US.
As we drill down into the data, we see this trend applies across all markets. Interestingly, Canada has shown up earlier in the year as a weak spot. In July, it looks like the other markets.
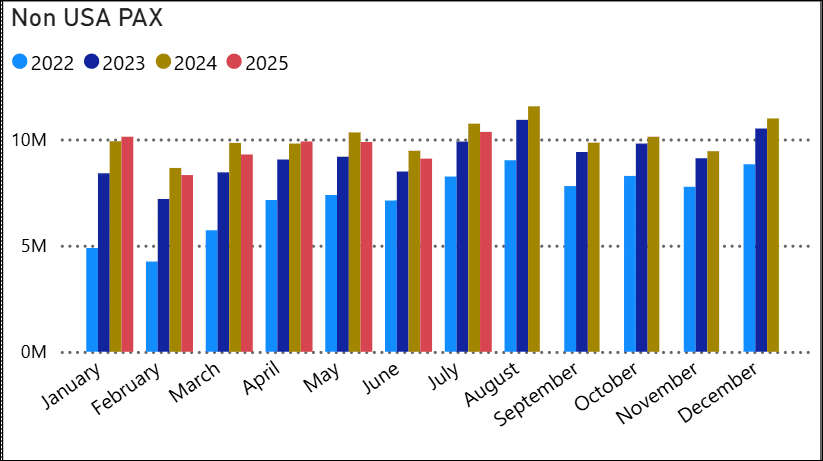
If we focus on visitors to the United States, this is what we see. Although July is softer overall, international travelers to the US look pretty robust. 2025 is softer than last year, but given the news coverage, not as soft as one might have thought it could be.
For the US balance of trade, this market strength is a big positive. Tourism generates a significant amount of revenue. Perhaps, in this media-maligned tariff era, market robustness reflects that consumers are essentially ignoring the punditry.
The challenge with monthly data snapshots is somewhat akin to reading tea leaves. You look back to see if there’s a trend and know that any exogenous event could throw off the trend. Fortunately, the I-92 data is processed fast.
As we noted last month, international travel to and from the US remains primarily healthy.
Views: 139


Excellent balanced article. Yes the U.S. international traffic is showing softness, but as yet the sky is not falling. Thank you for keeping your finger on the pulse.
How did July’s visitor numbers compare across different markets?