2019 07 25 11 43 10
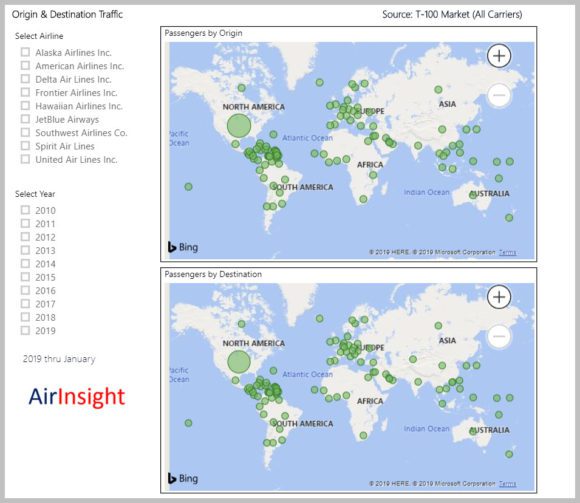
DoT has provided an update to their T-100 dataset. Here’s what the model looks like.
To make it run, please select an airline and or a year. For example, you can select an airline and then as you switch years, you see the two maps update. Or simply leave the airlines unselected and just change years to see the maps update. Mouse over any bubble to get details. Also, you can use the buttons at top right to drill down on the maps.
The key takeaway here is that among the US airlines as a group, the domestic market far outsizes anything overseas. Note also the significant clustering around the Caribbean.
Click the image to start.
Views: 0


