australia
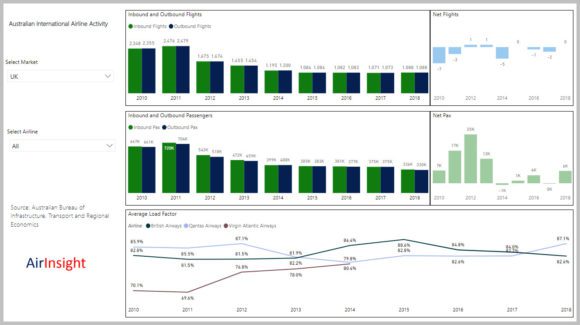
We have developed a data model showing Australian international airline and market activities, starting 2010 through the most recent published year, 2018. We plan to update the model when new data is provided.
The model allows a user to select a market – in the example below, we selected the UK. The model then shows flights, traffic and load factors. We also show Net flights and Net traffic. A positive means Australia is getting more inbound flights or traffic relative to outbound. Please click on the image to enlarge it. Once a market has been selected, a user can drill down by also selecting an airline.
Australia data is interesting as several markets show changes: the model shows where the key markets are and how each airline in that market is doing. Subscribers can interact with the full model here.
Views: 0


