
YuShu 56 scaled
Following up on our earlier story on Embraer’s campaign aimed at Lufthansa and LOT, we look at the competitive environment using North American and European airline data from skailark. What does EU regional fleet refreshing look like?
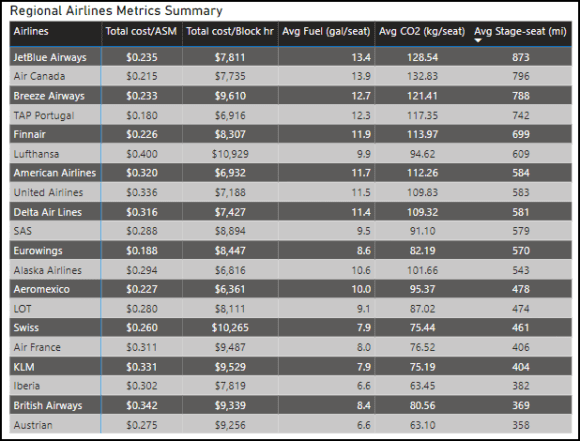
Setting the stage, the table below lists some key metrics. We expected to see that North American regional airline flights were much longer than those in Europe. On average, yes, but there are surprises, as you will see. While North American airlines fly, on average, 22% longer stages, they generate 30% more carbon per seat. That is not an outcome we expected.

We use the following table to provide the reader with a helpful list of metrics. The list is in descending order of stage lengths. We were again surprised to see a European airline in fourth place. TAP serves serval islands off the African coast, and this helps drive up the airline’s average stage lengths to distances similar to those in North America.
The following charts provide a view of both regions and flight operations. The charts have identical axes to compare how regional aircraft are deployed. We included the A220-300 in the group even though it could be argued as too large for regional operations. But we believe it is helpful to have a comparison for the E2-195 with which it competes. The ball sizes reflect the number of flights each model undertook in 2022.
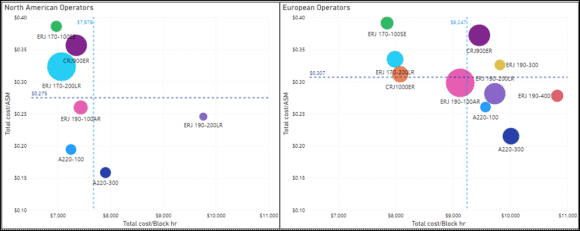
The charts have average lines that provide guides for regional performances. European average costs are a little higher. Regarding quadrants, the lower left is the best place to be – it offers the lowest costs per ASM or stage length.
- In the North American market, the A220s do well, and the E190s are close competitors. The smaller regional jets are in a quadrant together. Note there are no E2 in North American service.
- In Europe, there are no aircraft in the lower left quadrant. Europe has E2s in service as well as the largest CRJ1000. Europe is the market where we can see how the A220 and E2 compare. The charts suggest the A220 is a lower-cost aircraft.
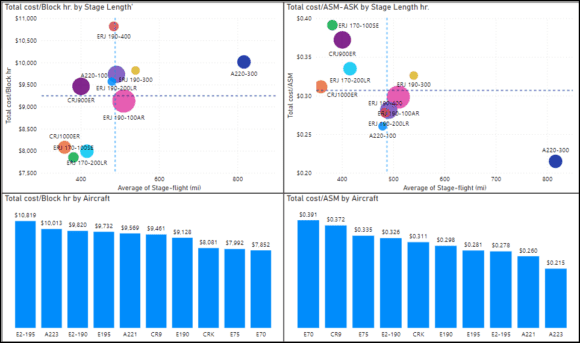
The following charts allow another North American to Europe comparison. The first chart is for European operators. The data suggest that the newest models are the most expensive to operate in cost per block hour. The newest aircraft are less costly to operate in cost per ASM terms. Since regional flights are short, the chart at the upper left illustrates that the older-generation regional models remain economically effective even if they are less eco-friendly.
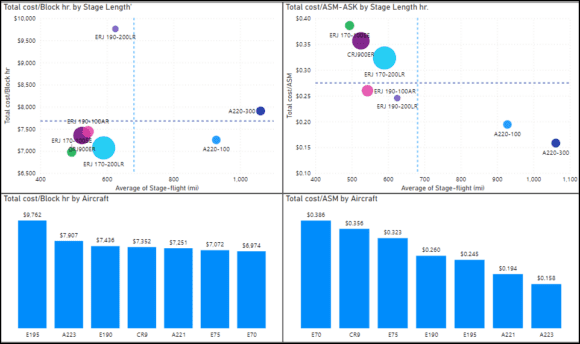
Next, here are the same charts for North American operators. The upper left chart gives the same result as we see for Europe. Since the United States accounts for over 70% of regional airline service, this set of charts might be considered the benchmark. It is tough to improve on the in-service aircraft.
Their engine technology is over 25 years old, and they are gas guzzlers with increasingly unfortunate ESG credentials. But without US Scope Relief, the United States regionals can’t deploy state-of-the-art aircraft. It may be an unpopular sentiment, but US pilot unions are on the wrong side of history. Scope weight limits, for example, are outdated and ensure US regional airlines remain bigger polluters than they need to be. But this subject needs to be dealt with elsewhere.
With this background information, let’s look at LOT and Lufthansa’s choices and tradeoffs. The backdrop to remember is that the Embraer media day was focused on LOT and Lufthansa. And the Embraer pitch focused on E2-190s and E2-195s.
Let’s start with LOT. The charts lay out where the airline is operations for these aircraft.
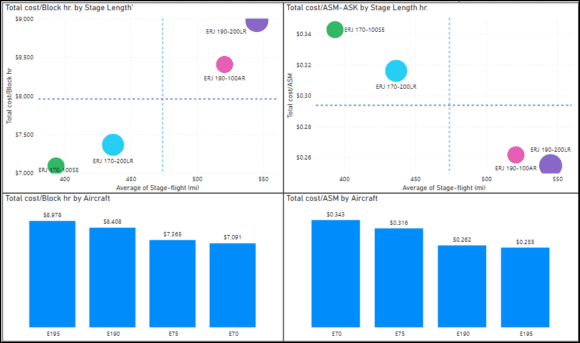
Here is the Lufthansa fleet.
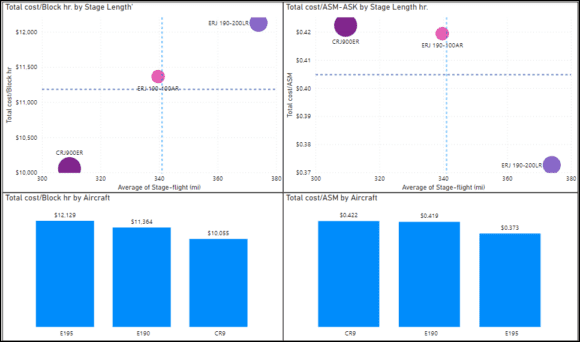
Would up sizing be the optimal outcome? The larger models offer more operational flexibility. The E2 offers better ESG numbers, which might be a critical decision driver. But there is a hurdle to overcome, as the E175 is a very capable and effective tool. Even the aging CRJ does a good job and is paid off.
Here is the LOT regional fleet.

Here is the Lufthansa regional fleet.

These two airlines offer Embraer potentially 100 replacements. For any OEM, this is an attractive market. Embraer has no regional jet competitor. Even with the A220 as an alternative, the A220 family may be too big. Also, the A220 backlog is a challenge – probably even for Lufthansa. Therefore the deals are Embraer’s to lose. The data shown here provides clues to the tradeoffs LOT and Lufthansa face.
Embraer is also chasing replacement of Lufthansa’s A319s. That is a great and appropriate target, but we would think the A220 as the advantage at that size.
Views: 2


