jetfuel e1589546483723
Fuel costs are an airline’s most significant exogenous input. They are impossible to control (hedging can only do so much) and can throw out any budget planning overnight.
Here is a data visualization of the US airline industry using Form 41 Table 12a. The green curve shows the wide variance since 2010. In percentage terms, those are vast swings. How does one plan for that?
- Page 1: On the summary page, notice the discrepancies in how much each airline pays. What is immediately apparent is that prices vary significantly. As the saying goes, “The big dog eats”.
- Page 2: Here, we show prices paid by airlines according to their type: network, LCC, and ULCC. However, the last segment might be changing, as it seems to be shrinking with the potential demise of Spirit. The curves show how competitively priced fuel is and how each airline tries to get the best pricing. Notice Southwest seemed to hedge from 2016 through 2018.
- Page 3: Here, we show the pricing by markets, international and domestic.
The data shows how crucial it is for airlines to negotiate the best fuel prices. This chart illustrates what US airlines face regarding operating costs.

Although the pandemic threw out the trend, fuel accounts for close to 60% of operating costs. Its impact is significant, and wide price swings cause budget havoc. The airline has already sold the tickets, so revenues are fixed, but costs can vary until the flight parks at the arrival gate. Remember Robert Isom’s excellent video from 2013?
Next, take a look at this table on fuel costs per flight hour. The greener the number, the better. Southwest is doing so well because it has an extensive fleet (the world’s largest) of new 737 MAX 8s that are highly fuel-efficient. Frontier and Spirit have deployed A321neos, and the results are excellent.

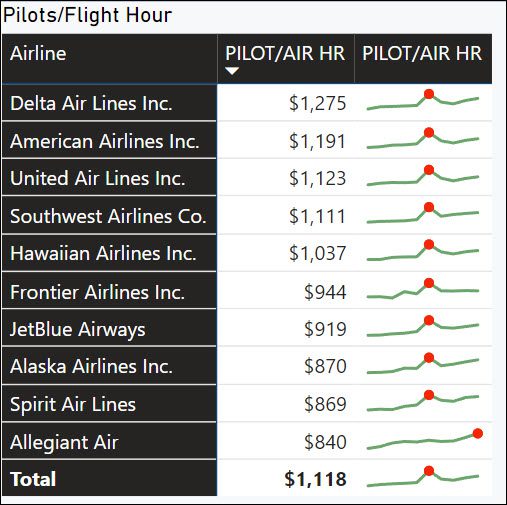
At this point, most people might be thinking about pilot costs. Here’s the chart. The red dot is the high point on the sparkline, which was the pandemic. The trend is clear.

The data illustrates why running an airline is so challenging. It also shows why airlines want to consolidate—everyone wants to be the biggest dog.
Views: 51


