2024 02 06 10 13 09
Yesterday, we updated our on-time data models with the latest data from the US DoT. We have several models that use this dataset, and while reviewing them, a few ideas popped out that are worth sharing. Subscribers have access to these models and can “play” with the various menus to dig into details. Here’s a post we did yesterday.
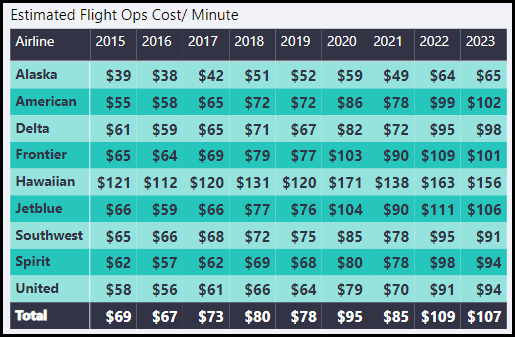
Let’s start with US airlines’ costs. Here is our estimate of the flight operations costs per minute. The 2023 data is not for the full year, but the trends are clear. Given Delta and United are running complex networks, their costs are impressive. As we will show below, Alaska may be the best-run US airline.
The reason to start with costs is that when one looks at operations, specifically lost time, it dawns on a reader how much money US airlines are losing from what might be called “sloppy” ops. That term won’t endear us to the industry. But let the data tell its story.
Airlines primarily sell schedules or time. Customers make choices by trading airfare costs with schedules. That is their tradeoff. Once a passenger selects a price/schedule that works and buys a ticket, they have the reasonable expectation they will get what they paid for. Well, good luck with that. Firstly, the contract of carriage was written to protect the airline, not the customer.
Secondly, US airlines are not delivering what customers buy. Airlines will take 100 cents on the dollar but don’t expect to get 100% of what you paid for. Let’s focus on arrival delays – you might leave late, but with schedule padding (more on this soon), you might arrive on time. But, nope.
It is important to realize that airlines and passengers desire identical outcomes -an on-time arrival. Why? An airline’s costs keep running; a delay means “lost time. ” Please watch this 2013 video of Robert Isom, then at US Airways, explaining the importance of sticking to the schedule. Today, Mr. Isom is the president of American Airlines.
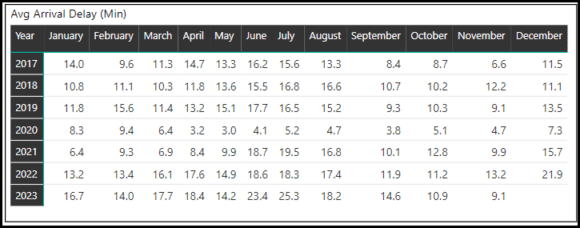
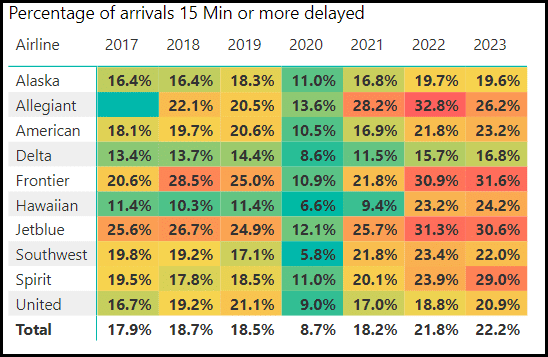
This table shows how poor US airlines are at staying on time. Note that it uses the spurious 15-minute rule. Schedules are not sold with 15-minute flexibility. For context, the number of flights where arrival delay is greater than zero, and then average those flights from 2017 through November 2023, the result is an eye-popping 33.5%. About one-third of US flights arrive later than scheduled.
To illustrate how spurious that 15-minute rule is, here’s a table with 2023 actual arrival delays. Discount the data by 15 minutes; it looks much better, right? But those 15 minutes hide a lot. Crucially, delays cost serious money, and every minute counts.
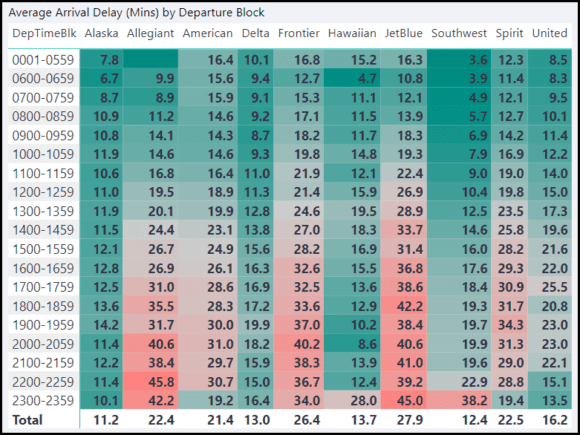
The table above shows how quickly some airlines lose their schedules. Once we hit lunchtime, all bets are off for an on-time arrival. The table also shows how well Alaska sticks to its schedule. We alluded to this above about how it may be the best-run big US airline.
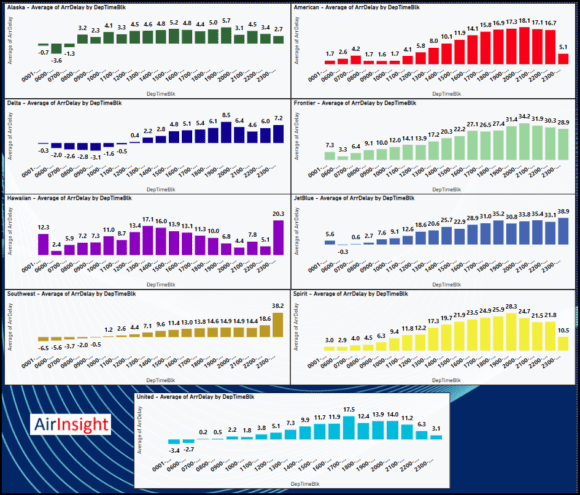
The last chart is small as it is a screenshot from a model. Using the 2023 data, we see how each airline performs regarding arrival delays by departure block. Please use this link to view the model at work.
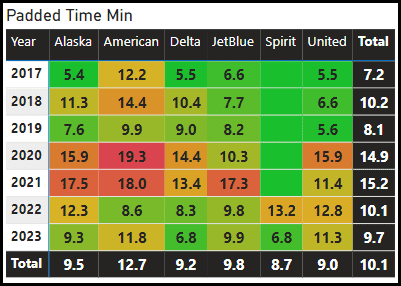
Finally, let’s look at schedule padding. Schedule padding varies by route, and we offer you two examples. Padding is the difference between CRS time and actual time. Green is better than red.
JFK/EWR to LAX:
JFK/EWR to SFO:
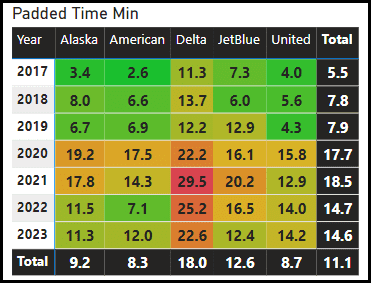
The time needed to fly the routes should be the same – these airlines use the same equipment to fly the same distance. What is it with all this padding? And over a 33% chance they still don’t get there on time.
Views: 19


