2019 07 15 13 27 11
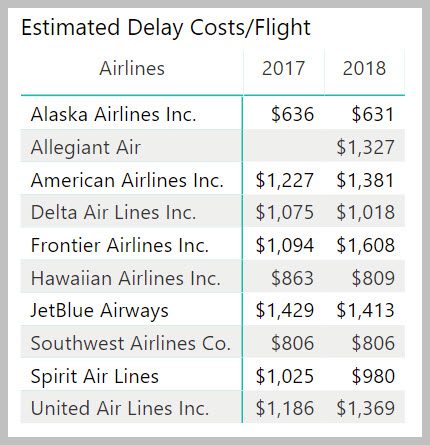
Our recent post on the costs of arrival delays reported a large estimated number. Perhaps the number was too big to make an impression. After all airline revenues and expenses are in the billions. But what we reduce the numbers into an easier bite-size? Take a look at the next table.
If we take the last two full-year data and estimate the delay costs and the average number of delayed arrival minutes we get the following for the large US airlines.
Are these numbers significant? We suggest they are. BTS reports the average airfare in 2018 was $350. Using that guideline we can see that a typical flight arriving late costs the equivalent of several seats. US airlines are flying at load factors over 80% so they might not feel the burden as much as they might.
The 2018 average among these airlines was $1,147 in estimated costs per delayed flight. That means the equivalent of 3.3 fares “lost” on average. For 2018 the airlines listed above averaged 179 seats per flight. We estimate delays mean a lost value in seat terms of 1.7%. Not much, right?
Bear in mind how the industry chased after 3% improved fuel burn from winglets. Or how the airlines chase ancillary revenues. That 1.7% amounts to big money. To get it though there is work to be done tightening flight operations. The lost value might be thought of as toleration of sloppiness, and consolidation has made the sloppiness tolerable. A lack of competition means record profits hides sloppiness.
Views: 25
About The Author
Take AirInsight for a Test Flight
7 days full access — premium analysis and the complete data model library — for $1. No commitment.
Start My Test Flight →


