2020 04 27 9 09 48
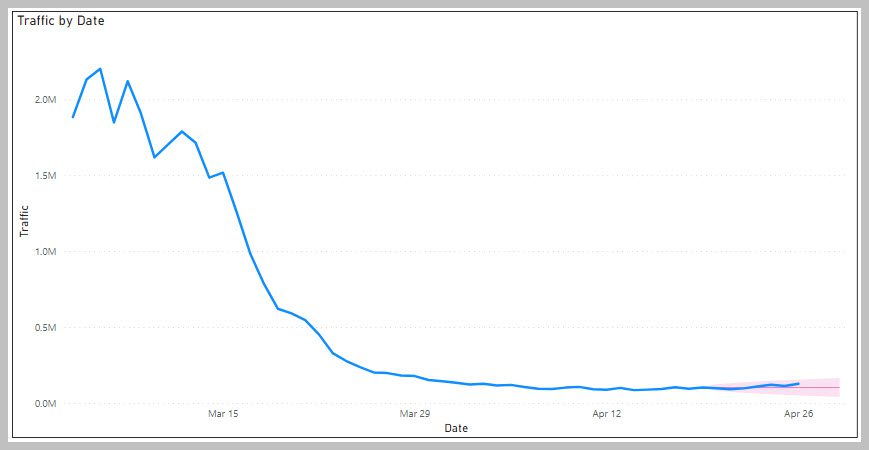
For those of you who follow the daily TSA checkpoint traffic (maybe) some good news, at last! True its early days and we don’t know if the upswing is sustainable or even real. But we do see something encouraging.
The chart shows the sharp dropoff in TSA checkpoint traffic that we are all familiar with. But take a look at the latest numbers from yesterday. The forecast in pink shows a straight line of what we might have expected. The forecast model has a 90% confidence interval and ignores the last seven days.
Click on the chart to expand it and notice that for a few days now, the blue line is above the expected flat line. Is this the bottom? Are we seeing, potentially, the first signs of a traffic recovery? We’re not sure. But like everyone else in the industry, we desperately want that to be the case. We will watch this closely and keep you updated.
One more chart that might show a “potential bottom” (April 14) more clearly. Hang in there and think good thoughts.
Views: 0


