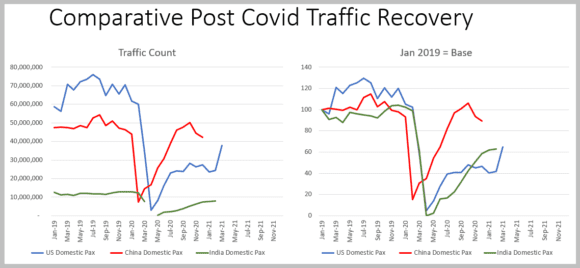
Worldwide, everyone is looking for recovery signs; whether this is medical or economic. The need to get out of the pandemic is universal, regardless of politics or creed. So how are we doing in aviation terms? We assembled passenger numbers for three key markets. The biggest missing market in the chart below is Europe. The data we found on European traffic is dated and not useful. If you have any suggestions of how to get equivalent numbers for intra-EU traffic, please email us.
The chart shows two views of traffic numbers. On the left, we show actual monthly counts. On the right, we show the same numbers with January 2019 as base = 100.
Left Chart
- Prior to the pandemic, the US was a much larger travel market than China. India, with an equivalent population to China, remains a far smaller market.
- China saw the pandemic impact about six weeks before the US. While both recoveries look somewhat like a “V”, the US recovery has been more wobbly.
- China’s recovery was rapid and perhaps too fast; later in 2020 traffic growth dropped off.
- The US saw a sharp recovery by end of 1Q21. We wait to see updated China numbers to see how that market has fared.
- India took a radical step and stopped all flights in April 2020. Since flights resumed, the market has recovered well and is closing in on 2019 levels.
Right Chart
- The 2019 numbers show just what a great year the US airlines had. Arguably the best year was followed by arguably the worst year.
- China and India both seem to have sharper V recoveries than the US.
- China saw September and October 2020 at levels over 100, suggesting a full recovery. But we see that was short-lived as November and December saw significant declines in traffic.
- India also saw its recovery growth rate slow after November 2020.
- The US data is more current and we see a strong recovery during the 1Q21.
Summary
- It will be interesting to see if the US air travel market recovers its former size and is larger than China’s
- This requires the US market to grow from 2020’s monthly average of 28m by about 80% to 2019’s monthly average of 68.4m – and the signs look promising
- While the 1Q21 monthly average for the US was 28m travelers, March saw a 55% growth over February
- For the first week of April 2021, we saw the US traffic volumes spike from the lowest daily numbers in 2020 to the highest daily numbers in 2021
- From April 1, 2020, through April 7, 2020, there was an average of 119,368 daily travelers, for the same dates in 2021, the daily average was 1.4m or 1,105% higher.
Views: 2


