2019 05 28 12 01 46
The US DoT data for 2018 has been published. Analyzing the numbers we generated preliminary data comparing fuel cost numbers for the MAX and NEO. (There may still be some gaps to fill) We stuck to fuel costs to minimize the chance of airline creative accounting. This is not a dig at the airline industry.
The DoT advised us as follows when we found some numbers to be odd: “While DOT has followed GAAP (Generally Accepted Accounting Principles) since 1989, there are a number of instances where we don’t. Our Chart of Accounts is pretty rigid. It does not change, to do so would require a Rulemaking. Air carriers will follow FASB pronouncements when reporting to the SEC, but we may instruct them differently. Case in point, FASB ASU No. 2014-09 told air carriers to record all ancillary fees as passenger revenue. We instructed the carriers not to. GAAP tells business entities (air carriers) to show “Other Comprehensive Income” below “Net Income” and specifically states “not to post to Retained Earnings on the balance sheet, but to create a new line item for it”. We do not have new line items and instruct the carriers to record it in Retain Earnings.”
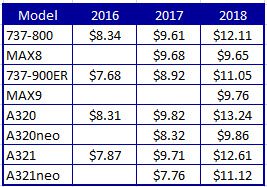
Back to the MAX vs NEO numbers. The chart shows the rise in fuel costs as oil prices have risen. We took the fuel costs and air hours from Form 41 table 5.2 and took ASMs divided by mile flown to get average seats from the T-2. The chart is a combination of data points.
The interesting item here is clearly the MAX8 curve. In 2017 the A320neo had a lower number and by 2018 they are about the same. Next, we go into the details.
- In 2018 the MAX8 we see fuel costs per hour per seat over 20% better than the 737-800.
- The MAX9 shows an improvement in fuel costs of nearly 12% over the 737-900ER.
- An item worth noting – the 737-900ER numbers look very competitive with those of the A321neo. This is not because the 737-900ER has equally compelling economics – it doesn’t. The Boeing is used more extensively on longer hauls and its fuel numbers benefit from this. The largest A321neo fleet in the US belongs to Alaska (flying them transcon) and it is too small to make a dent, for now. As American and Delta start getting their deliveries, we expect to see the A321neo fuel costs drop considerably compared to the 737-900ER.
- No data was published allowing for a comparison between the A321neo and MAX9.
- The A321ceo to A321neo fuel costs decline nearly 12% – which we think underscores the relative “misuse” of the A321neos at present. These aircraft need to have their legs stretched.
- Next note that the A320ceo to A320neo shows a fuel cost drop of 25.5% in 2018. This is quite a bit better than the MAX improvement over the NG.
Views: 107


A320 cabin width much better than B737. If you sit at the window seat you really notice the difference .I am 182cm in height.