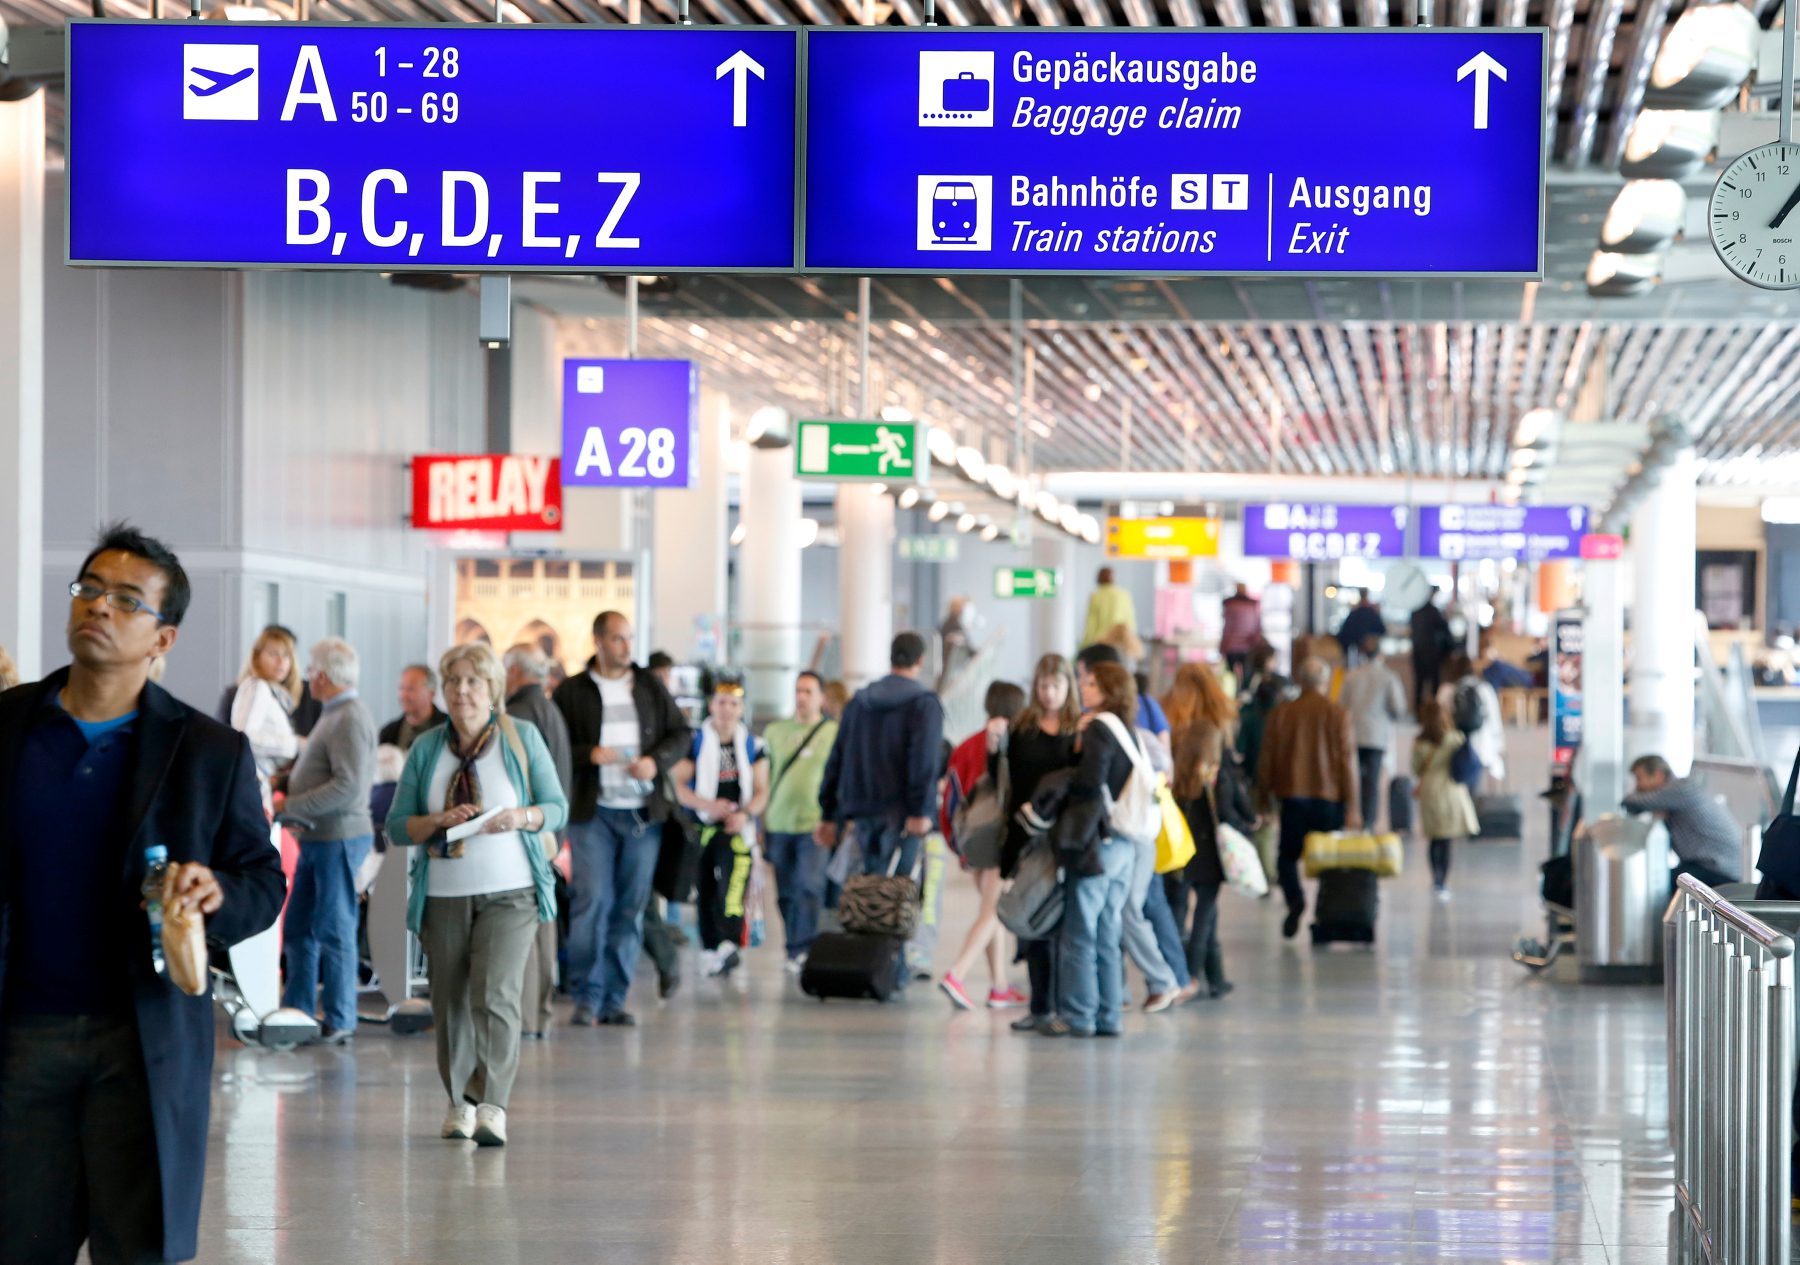
FrankfurtAirport
Air travel gets it in the neck frequently. Exogenous shocks are just another one of those things that happen. Pandemics ()there have been quite a few), wars, terrorism, and so on. People seem to adapt to anything, and the airline industry adapts. This link from ACI is a helpful third-party affirmation.
Global demand for air travel has grown steadily by 2.5% year-on-year since 1975. This is not an inelastic curve, but it sure shows the resilience of air travel. Driven by the emerging middle class, passenger traffic doubles every 15 years. The “travel bug” appears to be a reality; once it bites, you’re done and have to go someplace.
Using the US DHS I-92 data, we developed a model that looks at the top 20 international markets for US international air travel.
The left menu lists the top 20 markets. The table shows the number of passengers/flights from 2022 through February 2025. The dashed line is the trend line. The chart on the right lists the top 10 airports in descending order. The horizontal blue line splits US airports into hubs and non-hubs.
The model has two pages. The first is displayed here; page two is equally interesting and more straightforward.
On page two, we show the resilience of air travel, regardless of the market. Understanding this era of tariffs and the reaction to them is essential. One could argue that February is too soon to draw any conclusions—and that is a fair argument. But, all the same, air travel trends follow established patterns. The evidence suggests that changing these trends is not going to be easy.
Not only does it appear that travel demand is relatively inelastic, but demand for air travel is driven by growing economic status. The desire to travel appears robust, so any exogenous impact (like tariffs) is unlikely to slow down demand. What we might see is that travel changes destinations.
This change in destinations becomes a key issue in light of tariffs—for example, how many Canadians will forgo wintering in Florida and California? The data shows that Canadian-US travel grew in January and February. The trend line looks intact and positive.
Hubs vs Non-Hubs
Here are a few thoughts on hubs and non-hubs. First, hubs appear to have about ten times the traffic volume of non-hubs. But interestingly, there are markets where non-hubs report higher volumes per flight.
This second point becomes very important when considering the emerging Airbus A321LR and XLR. While hubs may keep their traffic flow volumes, it is possible that operators of these aircraft (and their Boeing equivalent) can “hub bust” and cherry-pick markets. For DMOs, this becomes a massive issue with significant economic upsides. Although these markets may be niches, they could be as valuable as the tiniest gold vein.
Views: 144


Great article!