2019 11 12 11 35 45
Airline flight operations data indicate how an airline is doing. Using a combination of US DoT sources we have been compiling models that allow this performance to be tracked. Here’s what we found about Jetblue (as an example).
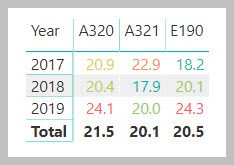
The first table shows the average delayed minutes for the periods (2019 through September) by aircraft type in the fleet. The colors highlight times that are relatively high. However, note that anything over 15 minutes is defined as late by the DoT. Our standard is stricter – any time beyond schedule is late.
From a fleet perspective the airline has been running late – by both the DoT definition which allows a 15 minute grace period, but more importantly, significantly late from its own schedule point of view. Digging into the fleet we have the following tail numbers that routinely run late.
The following table lists the airline’s average arrival delays since 2017. The data shows there has not been any on-time improvement. May 2019 was a relative bright spot.
The airline’s operational delays are focused as the following table illustrates. We see the same airports on both tables.
Flight Ops delays are not “free” nor should these be accepted as the way things are for the industry. Besides, there is an underserved annoyance to passengers who pay for the flight based on an advertised (and padded) schedule. Other businesses that perform this poorly make amends. Somehow airlines are immune. (That Contract of Carriage thing)
It is well understood that airlines face myriad exogenous factors that impact their business. But they already pad schedules to account for this. It is time for Wall Street to get serious about asking questions focused on Flight Ops performance.
This is not to focus particularly on Jetblue. We are merely using them as an example here. Here are numbers that should get Wall Street’s attention.
Based on the data model we developed, for 2018 Jetblue had an operational cost of $77/minute. Each delayed flight cost them $1,438 and well over a quarter of Jetblue’s flights were over 15 minutes late. Based on our stricter schedule-based definition of “late” we estimate this cost the airline $379m in additional Flight Ops costs.
Views: 8


