2020 09 17 8 21 45
The US DoT’s T-2 dataset may be the most useful for the areas we cover – it has many interesting data points. Several of our data models make use of this source, directly or in combination with other DoT datasets.
Subscribers have access to the updated models that utilize the T-2. Meanwhile here are a few examples of what we see in the update.
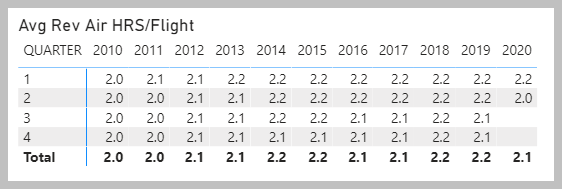
The table above lists single-aisle aircraft – US airlines are doing their thing in a largely consistent pattern during the pandemic, even with shrunken schedules and a mostly parked fleet.
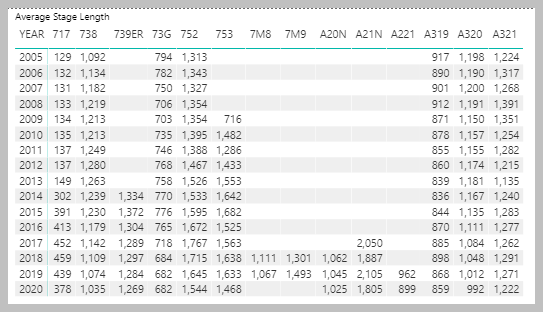
In terms of stage lengths, the item that draws attention remains Spirit’s longer flights. This airline is working its growing A320neo fleet. The other airlines show consistent performance. When we breakdown these stages by single-aisles we see the following:
Items that catch our attention:
- In 2005 the average stage length for these aircraft was over 1,000 miles and now it is below 1,000 miles.
- The A221 looks like a reasonable replacement for the A319 and 737-700 in stage length terms, which should make the case for the A223 even stronger. However, this also means that US airlines should be looking at the E190-E2 and E195-E2 as contenders for sub-150 seat “long thin” segments.
- The A320neo is being deployed the same way the A320, the additional range is not being exploited. Spirit excepted.
- On the other hand, the A321neo is stretching its legs compared to the A321.
- The A321neo continues to look like the 757-200 replacement, and given the small 757-300 fleet, probably can perform those flights as well.
- Airlines that bought the MAX are missing that aircraft’s better range, especially the MAX9. The MAX9 has the stage length performance to compete with the A321neo in US service. This means the A321neo range potential is not being exploited. The only airline pushing the A321neo in range terms is Hawaiian, with an average stage of 2,147miles.
Finally, we offer you an animated model showing how competitive the US airline industry is. The model illustrates the big three are neck and neck, year after year. It also demonstrates that Southwest keeps growing and should be expected to keep striking out beyond US borders more aggressively to chase markets.
Views: 1


