7 29 2022 11 14 26 AM
With Net Zero all the rage these days, you may want to at least have an idea of the impact your air travel has on the environment. Bear in mind industry people making clean sky promises are all going to be retired or no longer be with us in 2050. Meanwhile, take a look at your carbon footprint from flying.
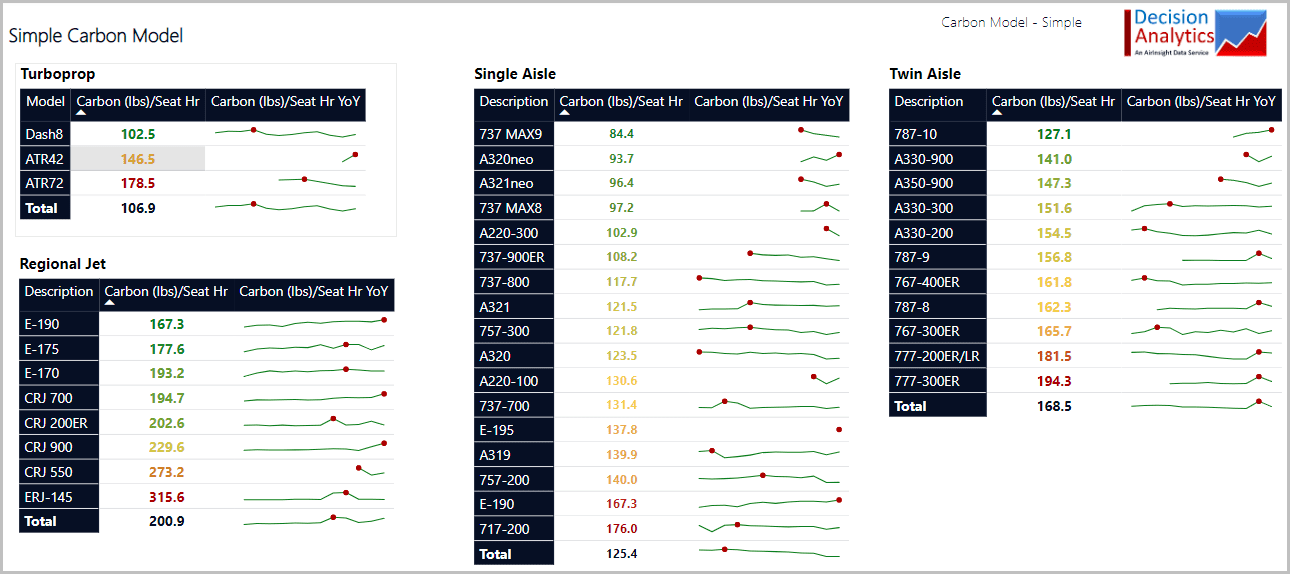
There are several sources and we’ve developed a simple one-page model. The idea here is to provide you with a quick reference number for air travel by aircraft type. What we’ve done is to track fuel burn per seat hour, using US DoT data, and then apply the amount of carbon produced per gallon of fuel. The number is 21.5 pounds per gallon as listed by the US Energy Information Administration. Other models offer a number based on the climb, cruise, and landing. And a plethora of other variables. The subject is complicated and the more you dig into this issue you realize the rabbit hole has no bottom.
In summary, we think taking a simple approach has merit. If you’d like to see a complex version, by airline and so on, please get in touch.
We have updated the model using the most recent T-2 data through 1Q22. The aircraft are listed in descending order of emissions – those on top and the greenest are the best. The “sparklines” show the history of the aircraft and the red dot is the highest emissions level over the period.

Views: 2


