Source: TSA; AirInsight
2019 was the best year for commercial aviation, followed by one of the worst. The pandemic did a number on air travel like no other. With 2024 behind us, we can now state that US air traffic has finally overtaken 2019 numbers.

Looking back, 2023 was similar to 2019, with slightly higher traffic levels. However, 2024 had a decidedly higher traffic volume.
Also, notice that the traffic patterns are back. The slow 1Q accelerates into the summer peaks, then tails off into fall and winter.
The chart also provides an idea of how disastrous the pandemic was. 2Q19 saw over 221m travelers, and 2Q20 was at 25m, a decline of over 88%. 2Q24 saw 236m – a respectable 6.8% better than 2Q19.
Even the annus horribilis of 2020 shows the remarkable resilience of US air travel. The US is too big for long-distance travel to be time-effective without aircraft. People must fly, suggesting a relatively inelastic demand. The airline industry knows all about this inelasticity.
Remember that old saw about traveling on Tuesday? It’s true, and here’s the data to back it up.

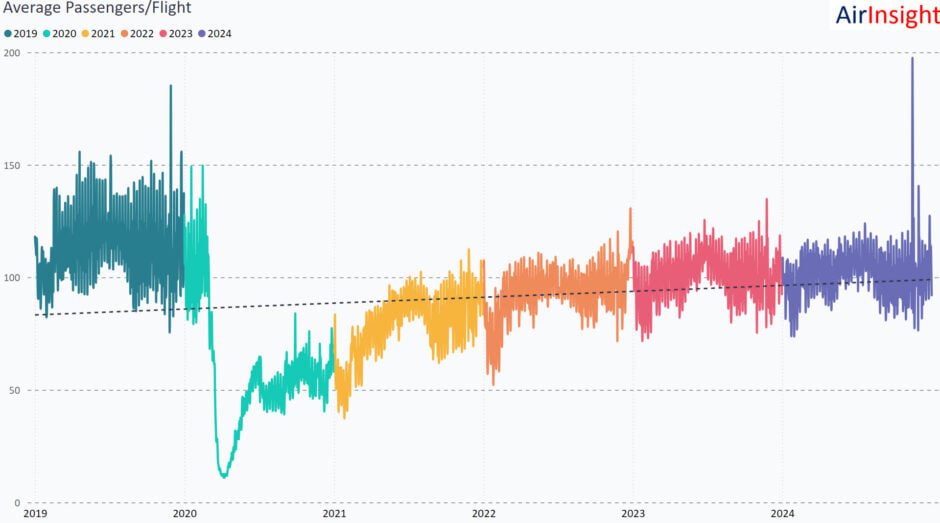
Another “feel” with actual data to back it up is that your flight is fuller.

Moreover, the trend suggests it won’t be getting better. Airlines may use larger aircraft, but that is mainly to optimize crew and operating costs.
With industry consolidation, airlines are increasingly more efficient at matching capacity with traffic. The airline industry has all the data we are sharing and more. Indeed, booking information up to 360 days in advance means optimal pricing buckets are offered at the right time. Which means, if you see a deal, take it. It will not be there for long. Anecdotal experience has shown that considering a reservation can change quickly enough that the first click can lead to no more seats at the price you thought you were getting.
Planning for 2025
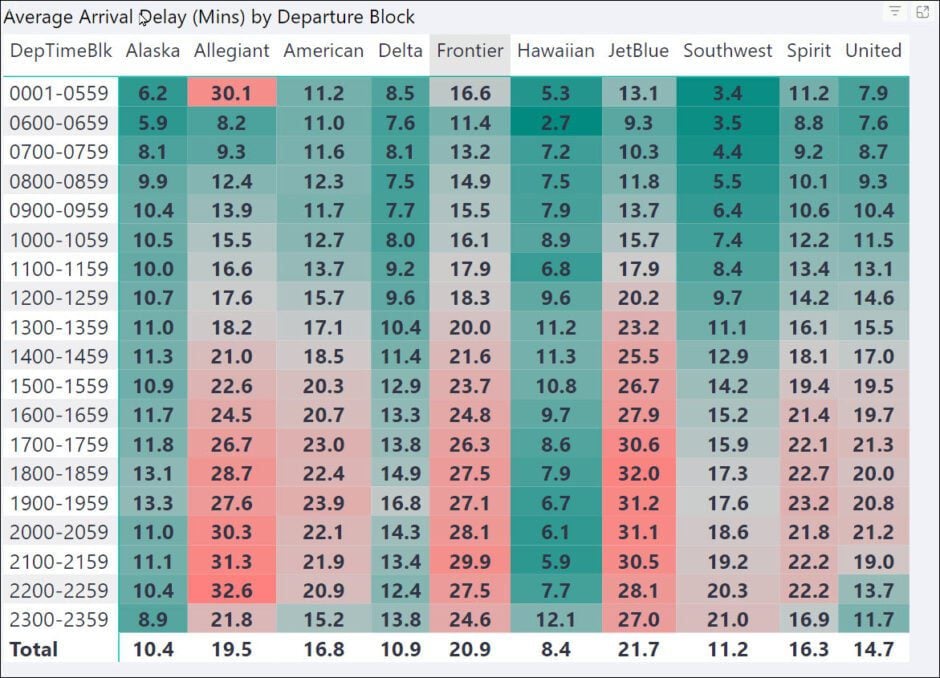
Fly before lunchtime – preferably as early in the day as you can. Not all airlines are equal when it comes to schedule performance.

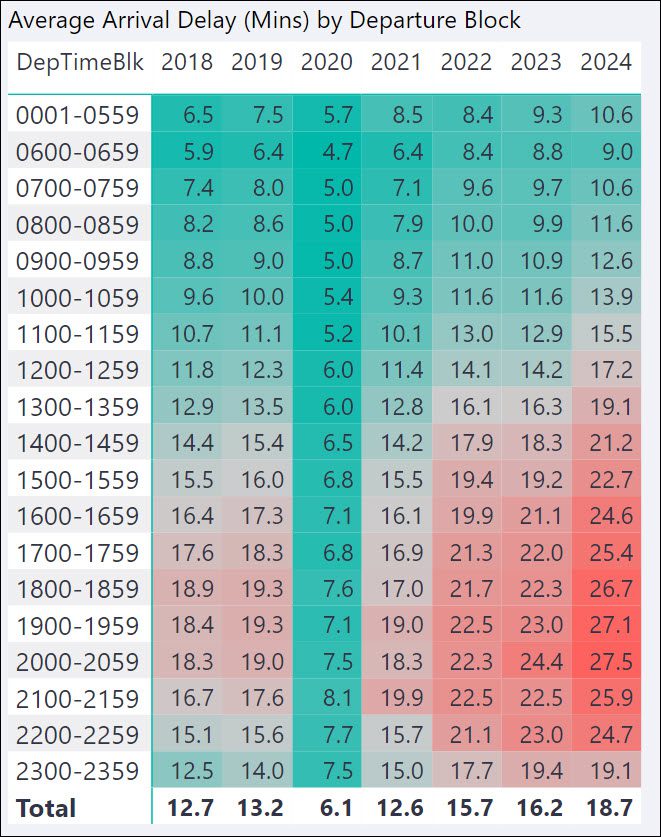
Air travel is getting much worse when it comes to schedule performance. Much worse, as this chart illustrates.

That’s your time wasted and uncompensated. Use this link to work through our model.
One last item you might find interesting. It’s called schedule padding. Airlines are among the most creative organizations when it comes to fudging time. Here, we also offer a data model to see how airlines creatively work with their schedules to appear “on time.” Use the origin and destination selection to see how each airline serving that market performs. Some of the numbers are amusing.
Finally, fly safe in 2025!
Views: 122


