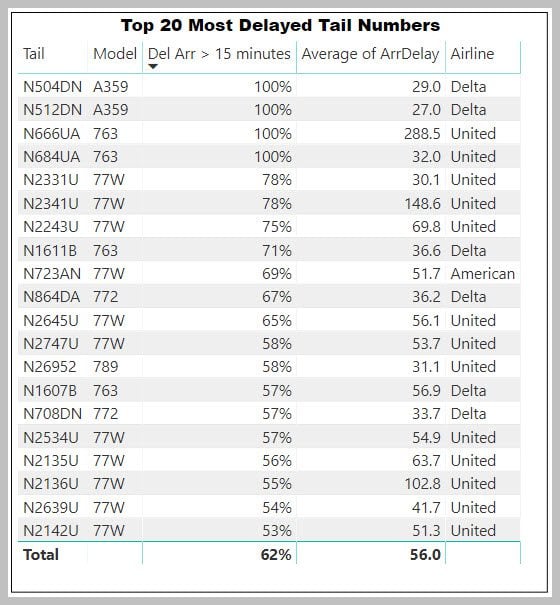
The US On-Time database offers a wealth of tidbits and here is one you may not have seen before. America’s Top Twenty most delayed tail numbers starting January 1st through August 31. The list is in descending order by percent delayed.
The table lists tail number, the type of aircraft and the percentage of its flights that have arrived over 15 minutes from scheduled arrival time. Then we list the average minutes delayed. You will have noticed these are all twin-aisle aircraft likely on international flights.
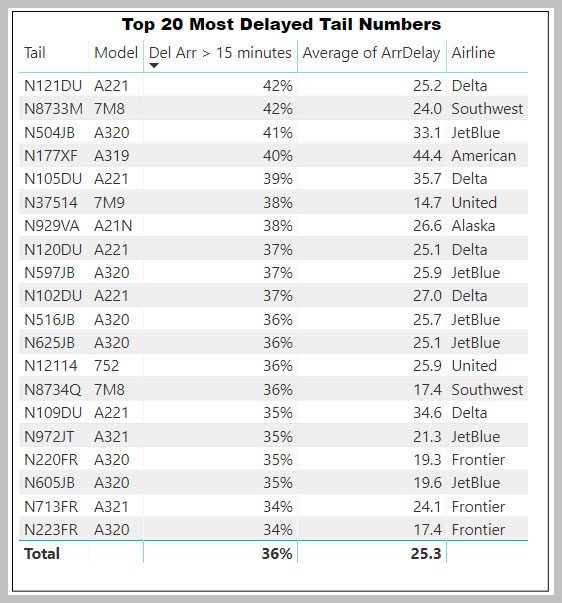
So here is the same table for single-aisle aircraft, set up the same way.
The single-aisle aircraft are, generally, have been operating at lower delays than the twin-aisles.
We would have updated the data through September, but the DoT site is crashing when doing the download. So, we hope to have an update soon.
Views: 0


Interesting data. The UA 77Ws are heavily skewed because of the India/Pakistan airspace closure early in the year where UA routes many flights through MUC and FRA with a crew change until dropping the flights entirely.
N666UA (creepily) cannot be similarly accounted for!!
Thanks Gene