2020 08 26 13 21 05
The labor layoff news from American Airlines is the proverbial tip of the iceberg. The US air travel infrastructure is designed to move about 2.5 million people daily. The latest number (August 25) was 523,000 – or 22% of the available capacity. There is no way the US airline industry survives the ongoing traffic decline as it is now. The frantic attempts to get Congress to come up with more for the industry faces an uphill battle. The entire US economy needs help. Severe adjustments are coming. It is awful, but one has to see it for what it is. Absent air travel being seen as safe again, travelers won’t come back in sufficient volumes. Moreover, those who can travel by air now is a far smaller group than in 2019 because of economic fears from layoffs and economic uncertainty.
Using the US Bureau of Labor Statistics, Occupational Employment Statistics dataset allows us to offer this model. The data for this model is dated May 2019. The data comes with the following proviso: “As with all data derived from sample surveys, OES research estimates are subject to sampling and non-sampling error. Sampling error occurs as a result of sampling from a population rather than recording the population’s true value; this is what sets a survey apart from a census. The variation that results from sampling procedures is given by a standard error. OES research estimates give the standard error of the estimate divided by the estimate itself, then multiplied by 100; this is known as the percent relative standard error (PRSE). For example, if the estimate of occupation A in state B is 50 and the standard error is 5, the PRSE of the estimate is (5/50)*100, or 10 percent.
OES research estimates are also subject to non-sampling error. Non-sampling error can occur for many reasons, including the failure to include a segment of the population, the inability to obtain data from all units in the sample, the inability or unwillingness of respondents to provide data on a timely basis, mistakes made by respondents, errors made in the collection or processing of the data, and errors from the employment benchmark data used in estimation.”
OES further advised us: “The data collected by the OES survey are based on a survey of business establishments, so the state and metropolitan or nonmetropolitan areas are determined by the location of the employer, not by where workers reside. It is also important to note that if there are no data available for an occupation in a specific state or area, employment for that occupation can still exist in that location. In some cases, OES may not be able to publish data for an occupation separately because of quality and/or confidentiality reasons. For more information on this, please refer to our FAQ page“.
In the model, we list the PRSE for each state, which you see as you mouse over each ball, along with the average annual salary. The ball size is driven by estimated total employment. Use the menu on the left to make a selection for the various occupations. This locates by the state for each occupation within the Air Transportation segment.
Readers will notice some weird anomalies: i.e. Chief Executives; Aerospace Engineers; Baggage Porters are among those that look odd.
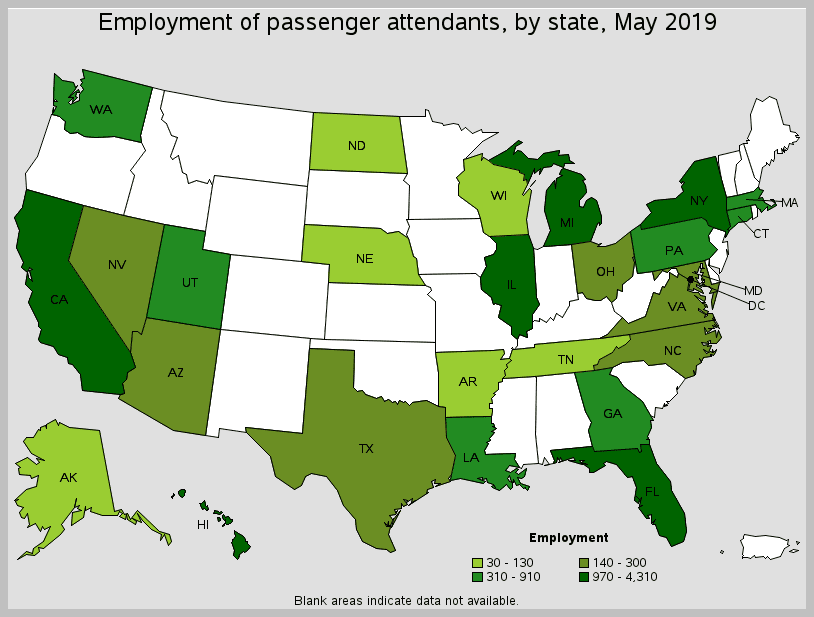
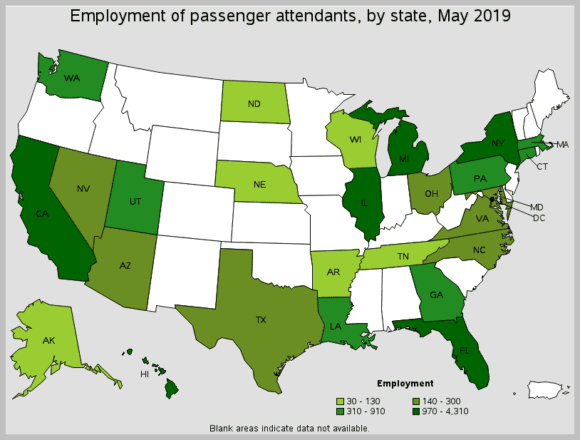
Elsewhere on the OES website, we can see this map of Flight Attendants by state.
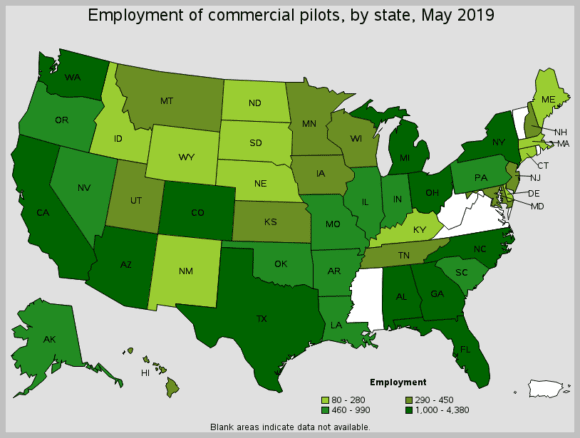
And here’s one for Commercial Pilots.
The labor pains for the US airline industry will be widespread.
Views: 1


