US airlines have been messing with seat counts for some time. The DoT data from the T-2 dataset allows us to demonstrate this.
Here’s how we get the average numbers of seats. Dividing the ASMs by the miles flown gets you to the average seat count. We then selected each aircraft type to allow for the tables to produce the comparative numbers.
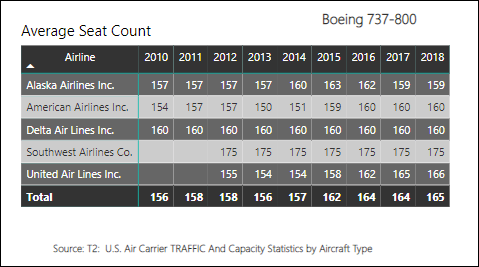
Starting with the 737-800, note how the airlines have messed with seat count. The total line serves as a useful industry average. American has moved their MAX8 seating to 172 and the -800 is sure to follow. A 6% increase in capacity from Boeing‘s intention when the -800 was launched as a 162 seater.
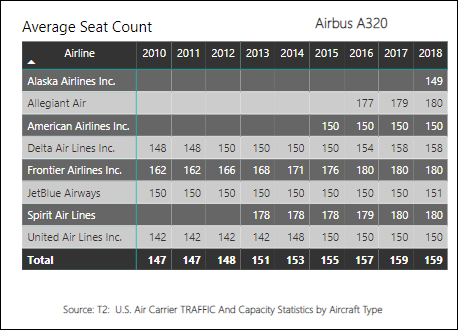
How about the A320? here we also see messing with seat count. The A320 started life as a 150-seater. Only a few operators have stuck to that LOPA. As expected the LCCs have squeezed more seats in.
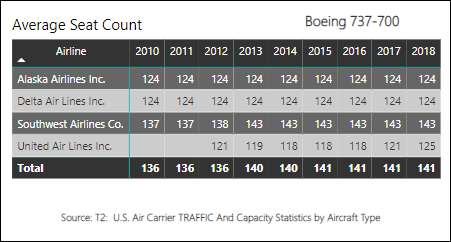
The same thing happened with the 737-700. In this case, it was Southwest that used a single class layout to get to 143. Given that Southwest is the world’s largest 737-700 operator, and ordered the MAX7, is there any surprise the MAX7 is planned for 150 seats?
How about the A319? This aircraft has also seen seat inflation. American and United’s feet are closest to the original.
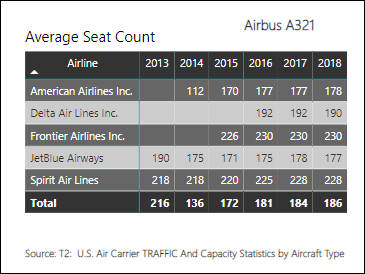
Messing with seats always seems to mean inflation. Our final example is the A321, increasingly seen in US skies as it replaces the 757-200.
Seat count has varied but seems headed to close to 200 and beyond for several airlines. The 757-200 used to be king of the 180-seaters. Now, this is Airbus territory. American’s 757-200 are at 178 seats, Delta’s are at 189 and United’s are at 163. American and Delta are switching to A321s which have compatible LOPA. United’s 757-200 fleet is special transcon configured for NYC to LAX and SFO. United and Delta both have large 737-900ER fleets and these seated (in 2018) on average 180 and 178, respectively.
It appears the US airlines are quietly increasing capacity by adding seats. High load factors encourage this.
Views: 5


