Delay and cancallation
If you’re still bored with sitting around waiting for the holidays to end, we got you.
Of course, our solution is another data model. This is great for killing time and learning something at the same time.
Have you ever wondered how much you spent going between two places in the US by air? How about schedule padding? That part where the booking system says one thing, but the actual time is quite different.
You may be surprised to see how long airlines need to complete a flight. Schedule and actual vary more than you might think. Our model consists of three pages: page 1 looks at airlines, page 2 looks at days of the week, and page 3 looks at months.
Our model focuses on the top 20 origins and destinations for brevity. The way the model works, select an origin point and then notice how the destination column adjusts only to show airports with flights from the selected origin point.
- The top table shows the expected CRS (booking) average time for the selected city pair.
- The middle table shows the average actual time the flight took.
- The bottom table lists the padded minutes (CRS minus Actual). In the third table, green is a relatively low padded time while red is the relatively highest time. Red is, therefore, not a good report.
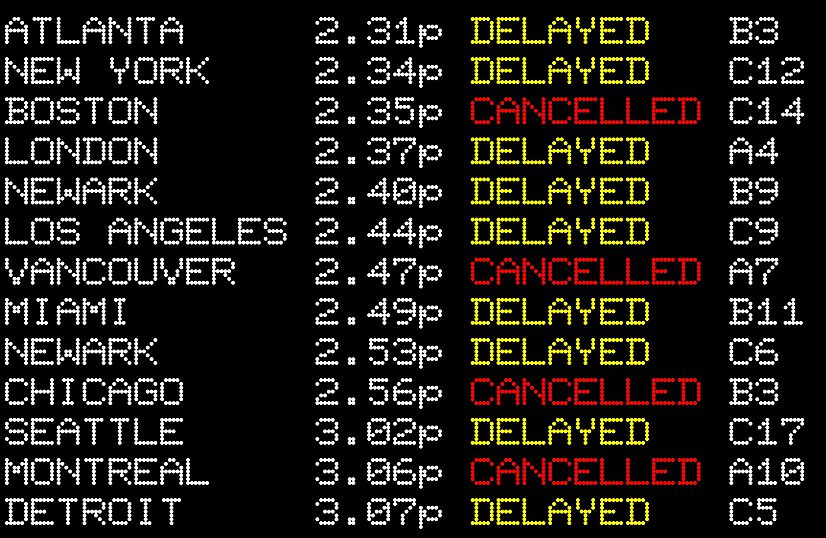
Remember that airlines sell schedules and every minute over schedule costs serious money. For the sake of this exercise, assume at least $100/minute. Then, consider the table below. As you see, the number of flight delays is huge – multiplying by ~$100/minute generates eye-watering costs.

Here you go – enjoy! Optimize your viewing by clicking the double-headed arrow at the bottom right of the model.
Views: 1


