2021 02 26 8 46 12
Two stories (one from The Air Current and our own) a week ago about a potential switch of Southwest Airlines away from the MAX7 to the A220 attracted attention. So, a week later, time to dig in some more as the DoT published December 2020 On-Time data. Now we have the full year.
Let’s start with Southwest’s on-time performance. The table below lists aircraft type, percent of flights 15 minutes or more arriving late, and the average arrival delay minutes. Note the 737-700 (73G) accounts for 75.9% of the flights for the period. It also accounts for 17% of the flights arriving 15 minutes or more late. 737-700 flights averaged a later arrival of just under 10 minutes while the 737-800 averaged eight minutes. Let’s ignore the MAX8 (7M8) for now as data for that airplane is a bit thin.
For context, 2020 saw a recovery to the “good old days” as the year progressed. The chart below illustrates how arrival delays crept up as flight schedules were rebuilt. Much better than earlier years, but the 2020 trend up is undeniable. The 2020 average arrival delay was 6.9 minutes.
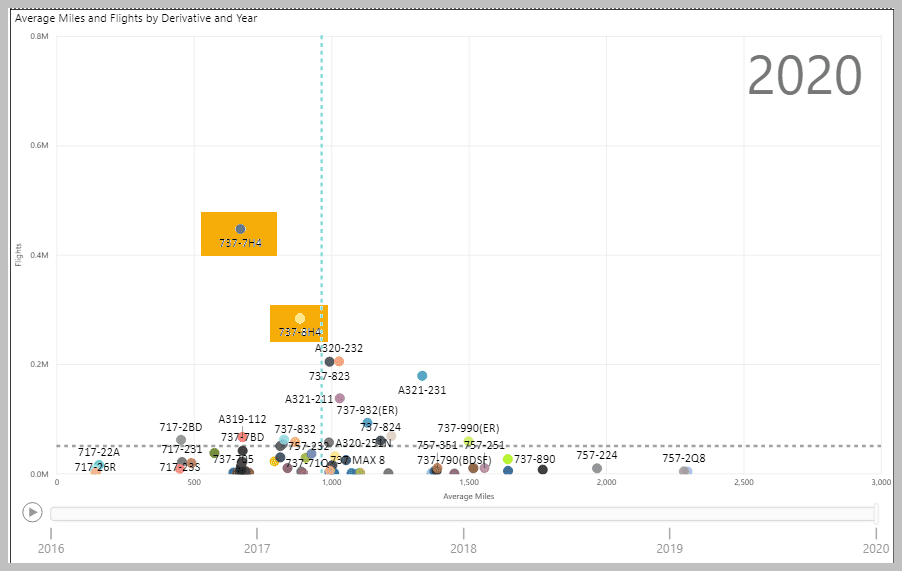
The Southwest 737-700 arrival delay number of about 10 minutes wasn’t so great. For more context, take a look at flight patterns for the US airline industry. Southwest’s fleet was busy in 2020. The dotted lines are industry averages for stage lengths and the number of flights.
As we have noted in previous posts, delays don’t come cost-free. For 2020 we estimate the US airline average cost per minute was $92 while Southwest’s average cost per minute was $74. We estimate the industry average cost per delayed flight averaged $644, while Southwest’s average was $249. Clearly Southwest has better cost controls.
Breaking down our costs estimates into aircraft type, and deriving the delayed arrivals, we get this table.
At Southwest, the 737-700 not only does most of the work, but it also incurs the most delayed arrival costs. While this model does about 75% of the flights over the period shown, it averages 80.5% of the delayed arrival costs.
What do the US airline industry’s 737-700 operating costs look like? The following chart shows the operational costs per hour trend, and it’s going in the wrong direction for operators. Southwest has the largest US 737-700 fleet and even though its costs are the lowest, the trend is not encouraging because even a small increase in the cost per hour is spread over about 450 aircraft. By comparison, Delta’s number looks awful, but they only have ten of these aircraft. As Delta adds A220-300s these 737-700s are likely to be parked or retired. In summary, operators are likely to be thinking seriously about offloading the 737-700. Especially Southwest.
The big issue here is, once you offload the 737-700 what do you choose from as a replacement? After all, there is a need for an aircraft of that size in the US and in other markets. Your choices include the A220 and E2. Both are fine choices. You also could choose the MAX7, but why?
Here we are again, looking at the 737-700 replacement and the A220 and E2 come up. Alaska has gone for the MAX9. United has elected the MAX9 and MAX10. Southwest is MAX8 focused. Where does that leave the MAX7?
Views: 1


