2020 08 07 13 49 47
The pandemic’s full impact is looming for airlines the world over, unlimited government QE is not going to last – it never could. Even in a US election year as contentious as this one, there is a chance that the US airlines may not see more support. After all, why do airlines deserve more help than anyone else? Besides the industry already was given $25Bn.
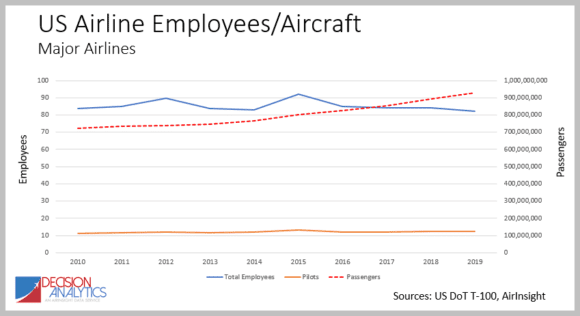
Here’s a recent history for the US major airlines. The chart shows the number of total employees and pilots per aircraft and the number of passengers from 2010 through 2019. Market demand has been robust and reliable. We can see the total number of employees slowly declining – an outcome of industry consolidation and other efficiencies. The number of pilots per aircraft remained relatively constant, ranging from 11 to 13.
The post-COVID world for airlines is radically different. The industry is heading for a major shrink. Having parked most of their fleets as they frantically reconfigure the business to match demand declines of around 75%, US majors are seeking a new equilibrium. Wall Street has suggested a 20% fleet cut. The largest US domestic carrier, Southwest Airlines plans to shrink 25%. Our data models tracking the US air travel market suggest a shrink might need to be more like 33%, at a minimum. Confidence in air travel is not recovering, despite fares last seen a decade ago.
If the current airlines stay in business until a recovery gains momentum, airline employees are going to have to endure career disruptions. Yes, again. This is not an industry offering great career stability.
What might we expect?
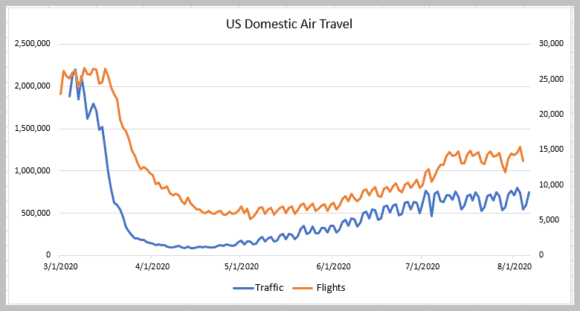
The challenge is offering a traffic forecast where history offers little guidance. Take a look at our chart below to better understand this. It shows daily flights (right axis) and people passing through the TSA at US airports (left axis). Notice that traffic and number of flights are diverging – we want to see both these curves growing, ideally with the passenger numbers at a higher growth rate.
What will make the traffic come back? Mainly this sentiment – is it safe enough to fly? There are several places to seek advice; CDC and even Boeing. A recent Gallup survey does not give us confidence though. If 52% of the US traffic doesn’t return for a year or two, that signals severe travel industry damage.
What should drive sentiment? First, in our view, travelers need to feel safe and the arrival of a vaccine may be crucial for that to occur. Work on a vaccine is going on at a furious pace. The economic incentives for developers are great. The next big factor, in our view, is economics. The pandemic has shrunk the US economy by a third already. The impact has been mitigated because of unlimited QE. That is surely going to end, especially after the election, regardless of who wins. That means demand for travel, even with a vaccine, can be expected to be muted.
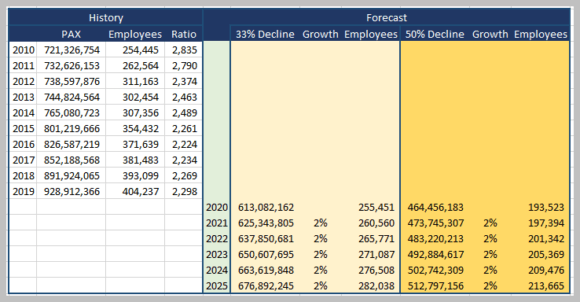
This brings us to a simple model showing what happens if 2020 sees a shrink in traffic between 33 % and 50%. Traffic drives the number of airline employees. Historically from 2010 to 2019, the industry has averaged 2,424 passengers per employee. With improved back-office efficiencies we rounded that number to 2,400 and use it as a base looking forward to 2025. We also use the FAA forecast of 2% growth. This may be conservative. Especially if there’s a bounce in pent up demand, but evidence suggests taking a conservative approach may be safer.
The two yellow bands provide a forecast of how many employees the US airline industry could deploy going forward. The pain occurs in 2020, where potentially there could be between 150,000 and 210,000 people whose careers are interrupted.
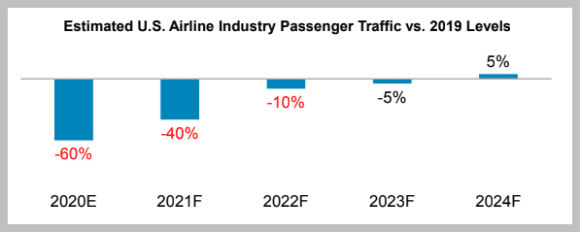
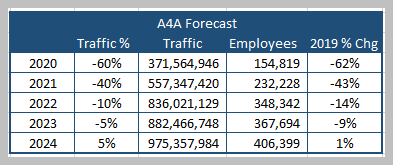
As an external reference, we sought guidance from Airlines for America, the US airline trade group. They shared this research from Goldman Sachs.
Using these metrics, and staying with an estimated 2,400 passengers per employee we get the following table.
The table shows a sharper drop in traffic and this could drive the airlines to undertake draconian layoffs to match staffing levels with traffic. This scenario is worse than our own by some margin – with 2020 layoffs of about 250,000 or 40,000 more than our estimate. The next half of the year is going to be painful.
Views: 5

