network
The US air travel market is arguably the world’s most mature. Consolidation has shrunk the number of operators to a handful of behemoths. These airlines are so large they could be defined as “too big to fail.” After several bankruptcies allowing them to adjust their costs (read labor), these airlines have evolved to a state where price wars are over. These behemoths will follow the rules of game theory and not harm each other with price wars. This means tough times for small US airlines.
But being the US, there are startups and smaller operators with ambitions. After all, the market is enormous. On a typical day, the US has over 22,000 airline flights with over 2 million travelers. The belief must be that there is a niche that can be served effectively. Having developed that niche, a startup can grow incrementally, chasing economies of scale.
This goal of economies of scale is crucial. This is the primary reason for industry consolidation: Alaska Airlines absorbed Virgin America, American Airlines merged with US Airways, Delta with Northwest, and United with Continental. It is also the goal of the JetBlue and Spirit proposed deal.
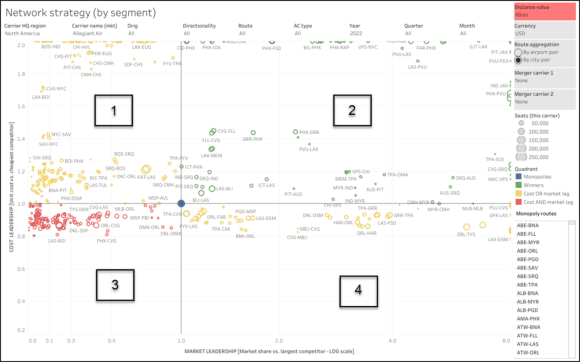
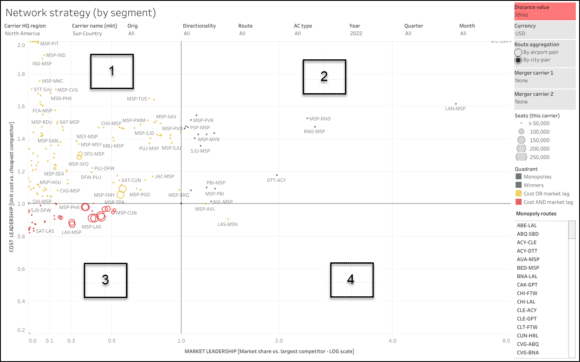
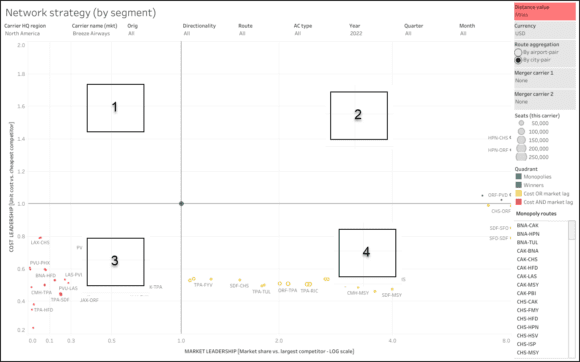
To illustrate how tough the US market is for small airlines that don’t have the scale of the majors, we have three network strategy charts from our colleagues at skailark. The skailark data model looks at cost leadership on the Y-axis and market leadership on the X-axis. The size of the circles represents traffic volume.
The chart is divided into four quadrants:
- Quadrant 1: Good score on cost leadership but not on market leadership. This is a tough market.
- Quadrant 2: Good scores on cost and market leadership. The best place to be.
- Quadrant 3: Low scores on cost and market leadership. The worst place to be.
- Quadrant 4: Good market leadership but lacking cost leadership. Another tough market.
- The blue circle in the center reflects monopoly markets, and the chart lists these at the right in alphabetical order.
The charts are very interesting, and one can quickly assess an operator’s relative network strategy strengths and weaknesses. The period we are looking at is 2022. Each year offers a fresh look at the operator’s strategy. Even though the US airline market is mature, the sheer size provides niche opportunities. For example, the shrinking regional market means several communities have been abandoned. These markets are economically unattractive because of aviation technology – specifically 50-seat regional jet economics. Could an operator move in with an efficient turboprop and make that work? In many cases, quite probably.
Allegiant
 The chart shows Allegiant Air’s network in 2022. Allegiant operates a fleet of 128 aircraft, giving it the eighth-largest fleet.
The chart identifies several markets in quadrants 1 and 4. We estimate that less than half of the airline’s markets are in quadrant 2.
Allegiant is a benchmark ULCC with among the lowest costs in the industry. This is why it cores rather well on the Y-axis. It has or is close to cost leadership across the board. Their strategy is to move as many yellow markets into the green, without attracting attention from larger competitors.
Sun Country
 The next example is Sun Country, with a fleet of 54 aircraft. The chart shows that the few markets in quadrant 2 are small. Its largest markets are in quadrant 3.
As an operator, Sun Country looks like remaining in a niche. So, moving into the freight business with Amazon Prime was a good move.
Sun Country has good cost leadership (quadrant 1) in several markets. The challenge is how to grow and move several to quadrant 2.
Breeze Airways
 The last example is Breeze, the latest airline startup. The chart reflects the airline’s attempt to identify markets where it can establish a niche. We see only four markets in quadrant 2, which are small in traffic terms.
It has several markets in quadrant 4. Here it has market leadership with no cost leadership. A challenge for Breeze is whether it can grow these markets into quadrant 2.
Quadrant 3 lists larger markets where it faces bigger competitors. With only 27 aircraft, Breeze can’t deploy any critical mass.
But it has some fleet advantages – 16 used Embraers at low capital costs and 11 new A220-300s. The latter can operate at market-leading economics and offers a coast-to-coast range. These A220s could be used effectively to grow the brand’s following. That requires time, and the behemoths will quickly uncover any success. Should Breeze discover a rich traffic vein, it probably will not be able to hold on to it for long.
Summary
These charts illustrate skailark’s data usefulness in identifying an airline’s network and ideas on evolving strategies. The three airlines mentioned seek markets they can exploit while minimizing competition.
An advantage these three have is the ability to move more quickly than the bigger airlines. Once they find a new market, they must move to develop it and keep their costs as low as practical. The US air travel market is brutally competitive.
Views: 2


