2019 10 25 14 08 32
We have published a new model that analyzes the US airline industry (major airlines). Here are screenshots of each of the four pages to explain what we have. Subscribers can access the model and select an airline to see how the model changes.
Page 1 – Operating Revenues
The upper chart shows the revenue sources in actual dollars. The lower chart shows the spread of revenue sources – passenger, cargo, mail, and the like. One can look for pattern changes to see what is happening with each airline’s revenue mix.
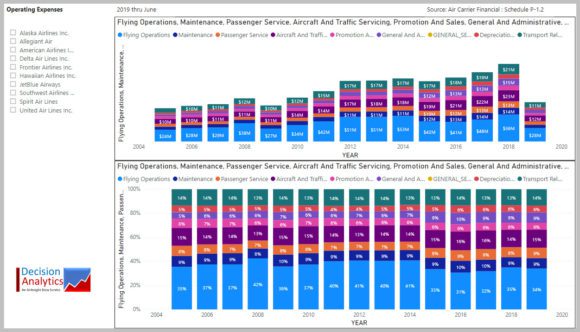
Page 2 – Operating Expenses
The upper chart shows the expense sources in actual dollars. The lower chart shows the percentage by expense type. This also enables one to look for pattern changes to see what is happening with each airline.
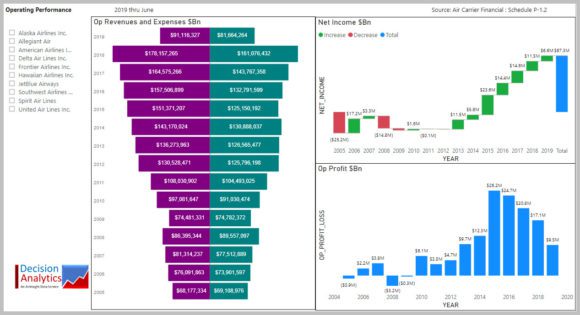
Page 3 – Operating Performance
The tornado chart shows the revenue and expense spreads, the waterfall shows the changes in Net Income over the period. Selecting airlines shows substantial variance among airlines, e.g. over the period Alaska Airlines has accumulated more net income than American Airlines. The Operating Profit chart is self-explanatory.
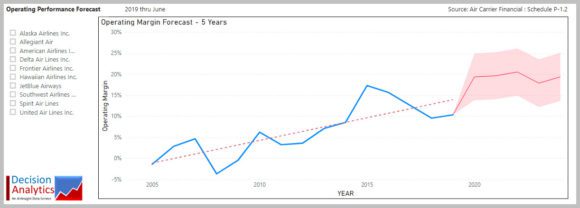
Page 4 – Operating Margin Forecast – 5 Years
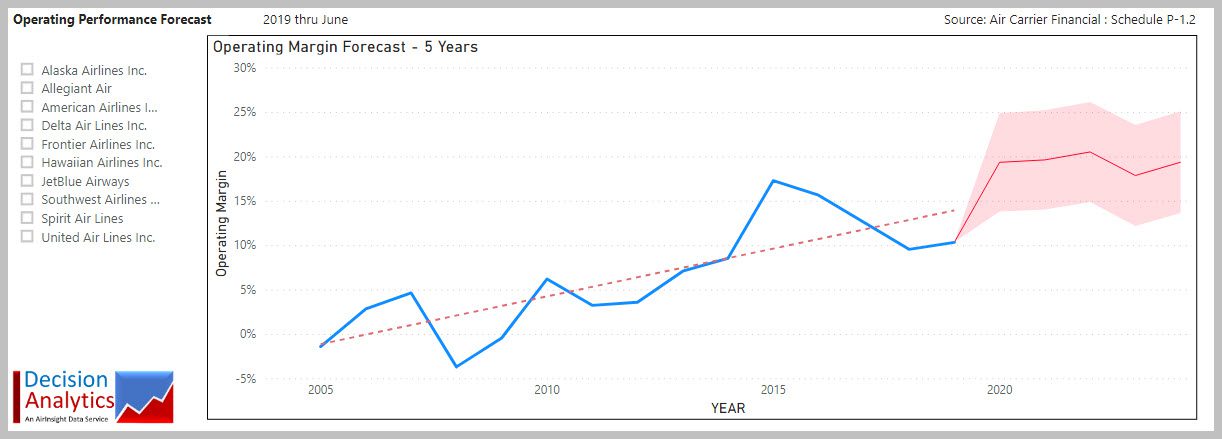
The fourth page of the model suggests the consolidated industry is robust with a operating margins likely to continue an upward trend. The trend line is relatively stable, and the model produces a forecast based on historical trends, with a high and low spread.
This scenario is, of course, not equal for each airline. Adaptive expectations and modeling based on the past can become tricky because exogenous factors can throw the entire forecast out of whack. But the models feeds from the historical data that underlie the projections. Of course, events such as new entrant carriers will disrupt the market and do so unequally – some airlines will be more impacted than others. For example, MOXY might disrupt Allegiant more than any other airline. But MOXY might also impact Southwest. Consequently, we have restricted the forecast trend-line extrapolations to only five years.
To minimize variance we went back to 2005 to obtain a substantial time period on which to build the forecast. This includes the pre-merger industry and some of the bankruptcy recovery periods. Of course, these models can be tuned and tailored. We look forward to your thoughts on this, our newest, data model, which is available to Subscribers.
Views: 0


