2023 04 19 12 31 53
Yesterday, AirInsight and Reuters reported that United Airlines is seeing ‘strong’ international travel demand. Post the pandemic, strong demand has been seen in the US domestic market. But because nations opened up markets at different rates international traffic has not been as buoyant. Here are US-International traffic trends.
Using the US DoT T-100 data, the following chart shows the amount of passenger traffic departing the United States through October 2022. We have a forecast at a 99% confidence interval, looking forward 12 months and ignoring the last 12 months. What we see is that traffic has been growing faster than projected. This supports United’s statement.

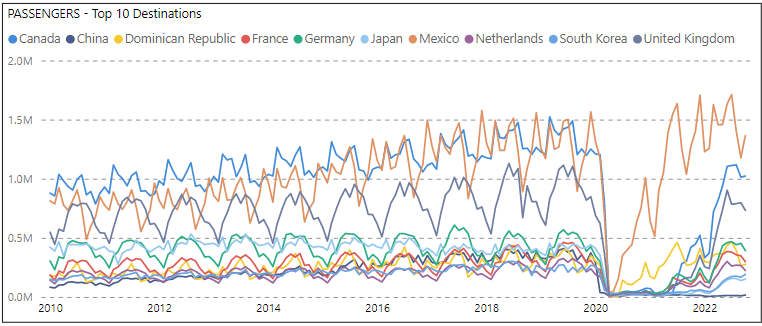
Next, looking at the Top 10 outbound markets for US travelers we see the following. As we’ve seen in previous charts, the drop-off from Covid was incredible. Literally a vertical instant decline. What is fascinating though is the recovery. Mexico came back quickly. Next was the Dominican Republic. It took a while for the remaining eight markets to open up for Americans.

When we look at the significance of these Top 10 markets, we see a change. These markets have typically accounted for about half of all American travelers, with a steady growth trendline. But from 2017 these markets have seen a decline in market share. The pandemic spike is like any data for the period – weird and out of line with longer-term trends. Indeed, we would argue that the 2022 data suggests a continuation of the decline seen in 2019.

So, if we see a strong recovery in traffic growth but a decline among the Top 10 – where are people going? The following chart shows all markets by region. Europe saw the sharpest rise and then a slowing. while remaining #1. Next is North America (Canada and Mexico). Notice that while Canada and Mexico saw growth early on, Europe as a destination took off sharply in early 2022.

Looking at Europe, here are the Top 15 markets for Americans. The UK is typically the equivalent of France and Germany combined.

Coming back to United, the airline announced several new markets: Malaga; Stockholm; Dubai; plus San Francisco-Rome; Chicago-Shannon; Chicago-Barcelona and Washington DC-Berlin. The European focus is no surprise given the data.
Finally to get another perspective of the US-Europe market we turn to another version of the T-100 to deliver the next chart. The size of each ball is driven by the number of passengers. The US big three have a combined strong market share based on flight frequencies. Note the average flight across the Atlantic only carries 177 passengers. Overall, typical flights have between 200 and 300 passengers. In 2022, American averaged 206 passengers/flight, Delta was 215 and United was 203.
This suggests that growing European flight frequencies among US carriers likely favors aircraft with aprroximately 250 seats. You know where to look.

Views: 3


