Regular readers know we have a fascination with flight operations. More specifically, with ground handling time. We analyzed the first three months of the 2018 US DoT On-Time data to see if we could identify anything unusual. Here’s what we found.
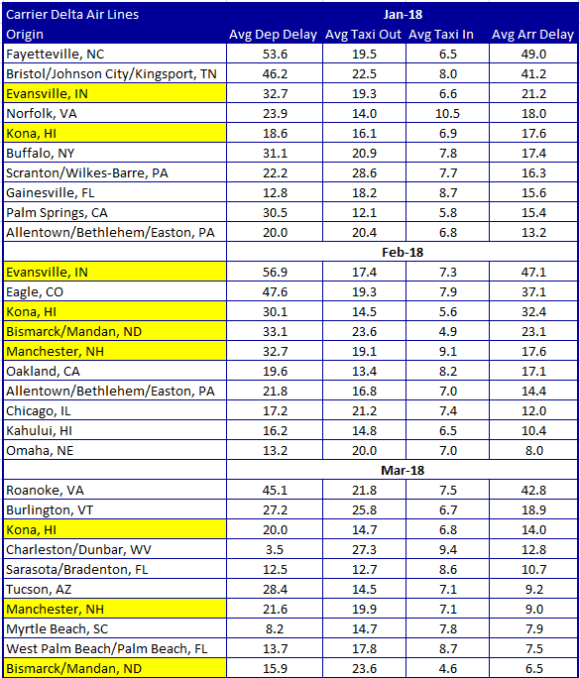
We selected American, Delta, United, and Southwest for the review. The tables are set up per airline for the three months. The yellow cities are highlighted in that they appear at least twice in the three month period. If a city appears in all three months, there might be an issue at that airport for that airline. Note that even if a flight had a late departure, the arrival usually shows some time has been made up. This probably because the crew saved time, but also because of airlines pad schedules.
As the tables illustrate, Southwest has the fewest cities with (shall we say) hiccups. Whereas American, Delta and United have hiccups at small cities, Southwest’s hiccups are at much bigger cities. That said, the level of operational delays for Southwest are an order of magnitude smaller.
Views: 4


