3 31 2022 1 22 15 PM
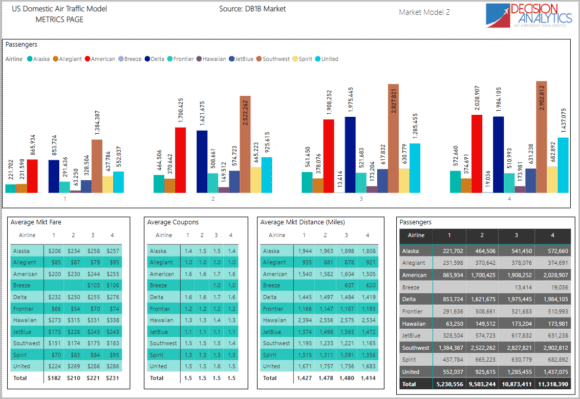
The US DoT updated their DB1B through yearend 2021 and we have updated our models. Subscribers, please take a look in the library. Meanwhile, we decided to create a snapshot of 2021 to get an idea of how the industry emerged from the depths of the 2019 pandemic hit. The chart below lists some metrics – note we have added in Breeze, even though it is still tiny.
Please click on the chart to make it larger on your monitor.
Starting with the large bar chart:
- Southwest Airlines was the fastest growing over the year in terms of passenger volume. The race for second place is between American Airlines and Delta Air Lines. United seems to have been on a slower acceleration.
- Breeze only showed in 3Q21 for the first time, and by 4Q21 it saw about 42% growth. This is great growth but the airline is still a niche player. Its strategy is still playing out and we have seen the airline switch out city pairs as it refines its markets. This is actually likely to be the most interesting airline to watch as it navigates between the giants. Anecdotal passenger feedback has been highly positive.
- Average Market Fare: Looking at the total row, fares rose steadily over the year. And that’s before the fuel spike in 2022to come. We again point out how Breeze has seen hardly a move on fares. It has to win over customers and this is a key way to do that. Its fares are not as slow as Frontier and Spirit. But they are way below Southwest. This gives us a clue as to where Breeze might be finding space for itself in this highly competitive market.
- Average coupons: On average passengers have more than one coupon. Allegiant is at 1.0 which is no surprise. But so is Breeze – again an interesting insight. Point to point focus. JetBlue at 1.1 is close to the same focus.
- Average stage length: This has always been a metric of interest, given the average stage length is way under 2,000 miles, why focus on longer-range domestic aircraft? Are airlines are flying heavier than necessary equipment? The tradeoff must be an interesting discussion in itself. No surprise that Hawaiian is the long-range leader. Notice the shorter ranges for Allegiant and Breeze. Overall we note that airlines have remarkably consistent stage lengths all through the year. Among the big three, Delta is the shortest, followed by American and then United.
- Finally passenger volumes: The number of passengers from 1Q21 to 4Q21 saw growth in excess of 110%. What a superb recovery. For context, the average growth from 1Q to 4Q between 2015 and 2019 was 15%. The decline in 2019 from 1Q to 4Q was 46%. That is why we use the word superb.
Looking back on 2021 the US airline industry weathered the pandemic shock and started a comeback. Perhaps not as V-shaped as was hoped for, but a robust recovery all the same. The pandemic didn’t give up easily, with Omicron arriving as people started to come back to travel. 2022 is going to potentially be another awkward year what with a war and a third Covid wave.
The hit the industry took in 2019 with massive layoffs, early retirements, and complex restructuring left it more resilient in January 2022 than it was in January 2021. One hopes the industry can weather the latest shocks without any further staffing impacts.
Views: 0


