AirInsight
We’ve been watching the data like everyone else. The data sources send different messages, depending on the reporting period. We reported on this in early June.
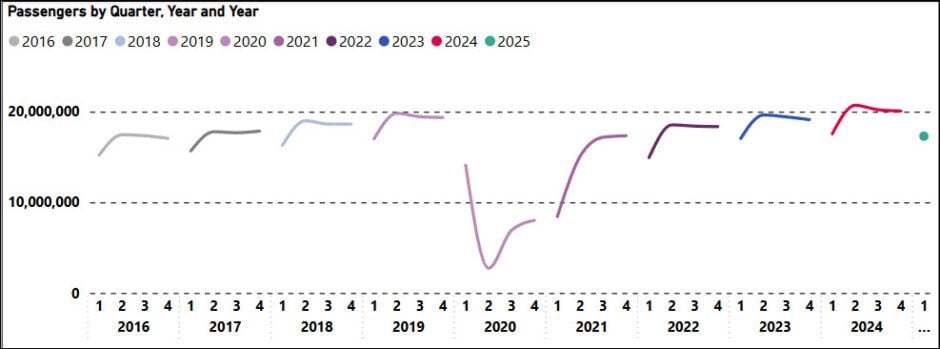
For example, if we examine the data through 1Q25, then yes, the trends appear softer. Below is the DB1B coupon dataset. 1Q25 certainly looks softer than equivalent past periods.

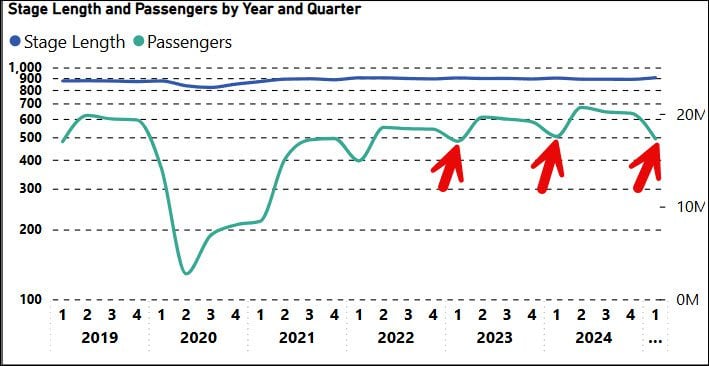
Here’s another look at the DB1B data. The arrows highlight 1Q numbers. 1Q25 looks softer than last year and closer to 1Q23.

Here’s a source we update almost daily. This source is typically three days late., making it nearly current and certainly current enough to see which way the trend is going.
Click on the year 2025 and see this chart. Here we can see why 1Q25 looked soft. February was weaker. However, since then, the market has perked up, entering the spring and early summer. It seems relatively stable.

Indeed, flights are stable at around 25,00 daily. Average flight loads are also back over 100. Click on the month in the model above to view the daily numbers.
Our interpretation of the data is that the early softening was an anomaly. It appears the market is stable and likely to see summer growth, as always does.
Views: 67


