2020 11 06 11 46 33
Regular readers will have seen the monthly videos we have with Professor David Yu in Shanghai. For some time he has been telling us about the rapid recovery in China’s air travel market. We have three charts that illustrate the remarkable recovery of air travel in China. Our source data is from CAAC monthly stats.
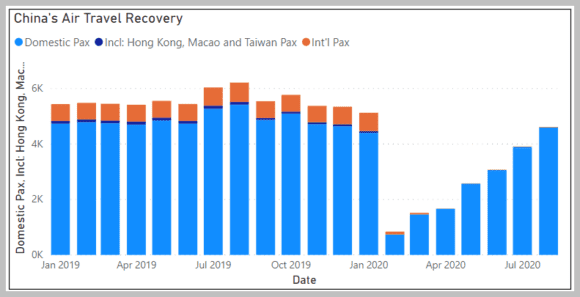
First, let’s look at traffic numbers.
Notice that China’s domestic market dwarfs its international traffic, including Taiwan, Macao, and Hong Kong. The recovery has been all about domestic traffic. It looks like the august numbers are about at pre-pandemic levels. This is clearly the envy of the rest of the industry.
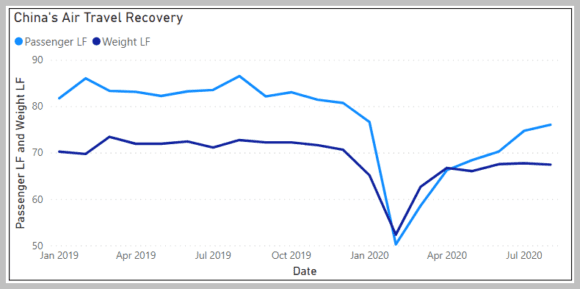
Next, let’s look at load factor numbers.
The V-shaped recovery clearly started in February 2020. Freight came back faster but by April passenger traffic load factors were ascendant and kept growing. Freight load factors are back at their trend from pre-pandemic.
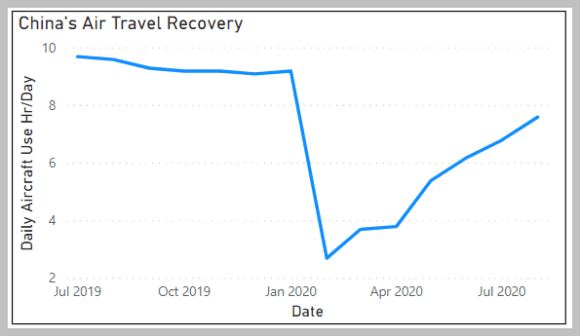
Finally a clue to Chinese fleet activities.
Aircraft in China are nearly back to eight hours per day after the precipitous drop off between January and February. The recovery is also V-shaped but was wobbly early on.
China’s air travel recovery is the world’s first since the pandemic. How China achieved this is open to debate and this is not the forum for that. We understand that fares were about at one-third what they were a year ago and fares vary continuously. For example, during the Chinese New Year fares rose in sympathy to the associated traffic demand.
Views: 0


