2021 04 07 10 53 13
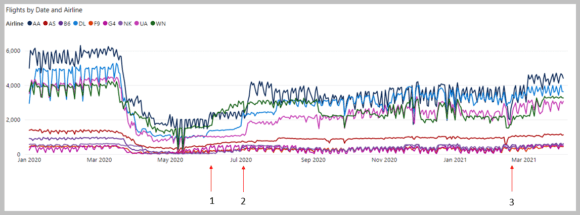
As we watch this recovery pick-up speed, it is interesting to see how many times the US airlines have tried to boost schedules in the hope traffic would bounce. Take a look at this chart.
#1 – June 2020
The first move was very early in the pandemic and was clearly not only ambitious but in retrospect, somewhat frivolous. The first mover was Delta on June 2, followed by American on the 4th, and then Southwest on June 5.
#2 – July 2020
Even though traffic had collapsed, hope springs eternal. On July 1 Delta spiked its schedule; on July 1 it went from 1,636 to 2,213 on July 2 a 35% rise. American on those same dates went up 13.6%, Jetblue went up 42.1%, Frontier went up 44.8%, Allegiant saw an incredible 99.5% spike, Spirit went up 2.8%. By comparison, United went up 5.8% and Southwest went up 4.4%. As the chart shows, American stayed aggressive – its schedule rose from 2,186 daily flights on July 1 to 4,187 by July 10, a 91.5% rise.
#3 – March 2021
It took a while for the industry to realize just how severe things were. Even so, schedules slowly kept creeping up. As our chart shows, schedules grew faster than loads. It would seem this industry, even though consolidated and more disciplined, still can’t resist chasing market share. Mid-February 2021 saw a short slump but by week three, it was back to growth. Between February 20 and March 1, American grew its schedule by 22.8%, Frontier by 22.8%, and Allegiant by 34.2%. The remaining airlines were more cautious.
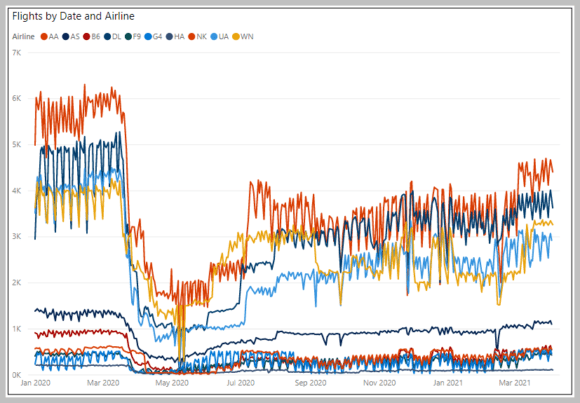
Looking at the history from January 2020 through March 4, 2021, notice how the big airlines have moved places. American has tried to offer the most flights consistently. Delta has remained #2 with a smaller difference in flights compared to American now than at the start of the period. United was #3 early on but now is #4, swapping places with Southwest. As the chart illustrates, American and Southwest are showing the most schedule ambition, or is it aggression?
The data shows that United has been careful in growing its schedule. We would say the same applies to Alaska. This suggests these two airlines may have kept their costs lower by not bringing more assets (people and planes) to the market while traffic remained soft. During the “good old days” of 2019, the industry averaged 114 passengers per flight. April 2021 shows an average of just over 80. So holding back on schedule growth likely helped with reducing cash burn at these two airlines.
Views: 1


