2019 08 28 12 50 56
As the catchall for so much traffic, the Port Authority’s airports play a big role in the US air travel system. Hiccups in the New York area soon trickle across the US and even impact overseas markets. As we have seen, big winter storms New York have to lead to global airport delays.
The PANYNJ airports accounted for ~6% of total flights in the US, on average between January 2017 and June 2019. Yet the impact from these airports is substantially higher than that number indicates.
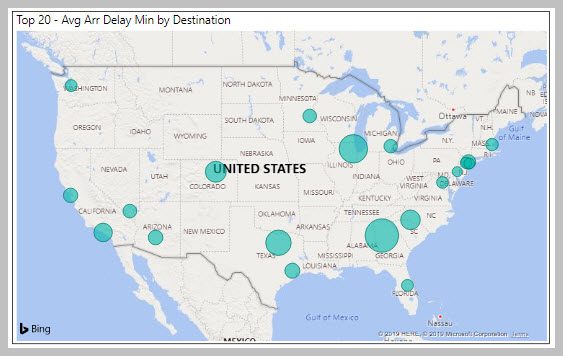
Our first chart shows the average arrival delays at the key Port Authority airports, in minutes. The 2019 data is through June.
Here are the departure delays, also in average minutes.
Looking at the average delays over a monthly basis we see the following. (Click on the image to expand it)
As traffic builds from spring delays creep up, as one expects. Then, post the summer surge, delays decline. Among the three airports, Newark (EWR) is most delay impacted. This is a key issue for the biggest airline at that airport, United. The following chart shows that United is by far the airline most impacted by EWR delays when looking at only the Big Four US airlines.
What about the other two big airports? Here is the LaGuardia (LGA) picture, which is more balanced.
The picture for JFK, among the Big Four, is as skewed as EWR.
Looking beyond the Big Four, we see the following for Arrival delays for 2019 through June. Combining the numbers for the big three of the PANYNJ airports we get this table.
The color-coding highlights significant delays (red). In the next table, we show Departure delays in the same format.
The PANYNJ big three airports show more departure delays than arrival delays. Airlines have padded their schedules to appear more “on-time”. As we have noted before this padding is hiding rising delay costs. We estimate that using $90/minute 2019 operational costs for the airlines, these delays amount to eye-popping numbers. The following table illustrates this. The DoT estimates1Q19 airfares averaged $353. Which means airlines are losing two to three fares per delay.
Passengers don’t see this but surely sense it – nor, apparently, do the shareholders, who should be even more concerned. Given the impact the PANYNJ airports play on the national system, we see the probable start for schedule padding with departures. (Subscribers can utilize the model to dig deeper and look at other US airports)
Views: 3


