2021 01 21 7 56 42
Now that the MAX is flying again, let’s take a look at what MAX operators might look forward to in terms of operational costs. After all, MAX operators are facing stiff competition from NEO operators. Both aircraft operators are seeking to save every penny from their operations.
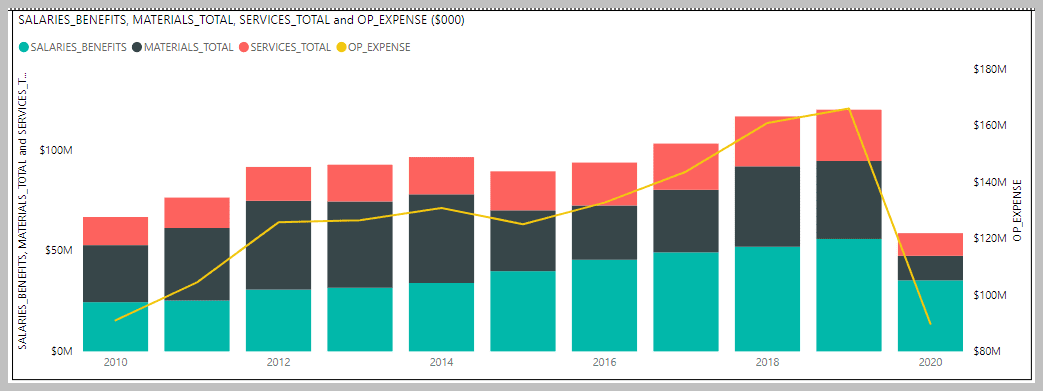
Current market conditions provide even less margin than “normal” times. There’s not much traffic and despite low fuel costs airlines face an odd situation. During “normal” times labor and pilot costs have been rising. Using 2019 as the most recent “normal” year, labor was 34.4% of US airline costs. (Subscribers have a model to use allowing airline comparisons) As the following chart illustrates, labor costs have been rising for several years.
Now let’s break down labor costs into smaller buckets and we get the following chart. Flight crew costs have seen a steady rise through 2019. The 2020 data is through 3Q20 and we anticipate it won’t decline for the 4Q20. Our reasoning is that despite the pilot layoffs and furloughs, pilot unions focus on seniority. If you have seniority, you get furloughed or laid off last. Consequently, as airlines thin pilot ranks, it’s the most expensive people that stay. Which is, from an airline point of view, the worst possible cost outcome. But what can you do?
Next, let’s look at flight operating expenses. It’s all about the fuel costs.
To summarize US airline operational costs we offer the following chart, which provides the relative context for the major inputs. Clearly, the industry’s biggest costs are related to labor and materials, and of those two, pilots and fuel are the largest. Pilot costs are a given, so we focus on fuel burn as that is where MAX vs NEO becomes interesting.
Now let’s get to the MAX and NEO. The data we share compares numbers from US airlines, and for non-US operators, the benefit is to see the relative numbers and use them as a benchmark. The MAX has a short operating history and we will see fresh numbers for 4Q20 when they are updated. Note that these 4Q20 numbers could be significantly higher than you might expect because there are likely to be “reset” costs associated with the MAX re-entry into service.
For the NEO fleet, which saw continuous operations we have more history. Note the crew cost for 2020 rose – a hint at what we think reflects that airlines have kept the most expensive crews during the furlough period. Notice how fuel burn improved over time. We see the same for the MAX.
In summary, MAX operators will aim for flight operations at better than 2020’s NEO $0.1718 per seat mile. Achieving this allows them to become the lowest cost operators and drive down fares to attract the little traffic that exists. It’s always about being the lowest cost producer. In the US though, the largest LCCs are Airbus operators (Allegiant, Spirit, and Frontier). We expect the lowest MAX numbers to come from Southwest. In 2019 Southwest was at $0.0933 for MAX flight ops/seat mile, so the NEO benchmark is achievable. Of course, that 2019 Southwest MAX number is likely to be quite different now, reflecting the new realities the industry faces in 2020.
Views: 4


