2024 05 29 11 09 01
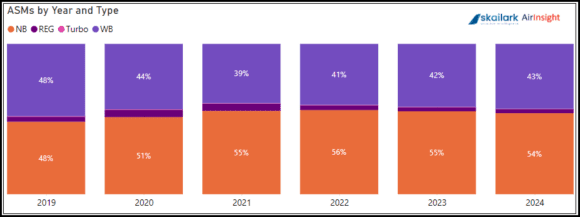
Regional air travel is a big business that is constantly under pressure. Skailark data demonstrates the following analysis on a global scale. The following chart shows the relative amount of ASMs flown by aircraft types.
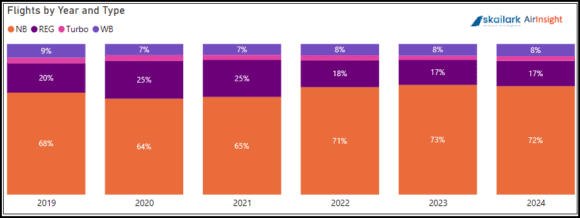
Another way to view regional flying relative to other commercial activity (excluding freight) is to show the same chart by number of flights.
The chart shows that while regional flying is small in ASM terms, its impact is much more significant regarding operations. The pandemic saw regional flying expand its influence, but flight ops have settled back into the typical patterns post-pandemic.
Looking at regional flying across the markets, we see the following.
As we have often noted, regional flying is primarily a North American activity. Other regions with similar distances (China and India) should see this segment grow. China has tended to focus on high-speed rail, but India offers promise.
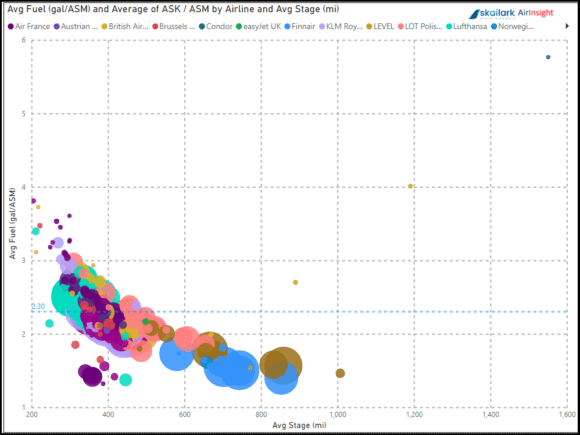
Breaking down regional flying by world regions, we see the following.
Europe
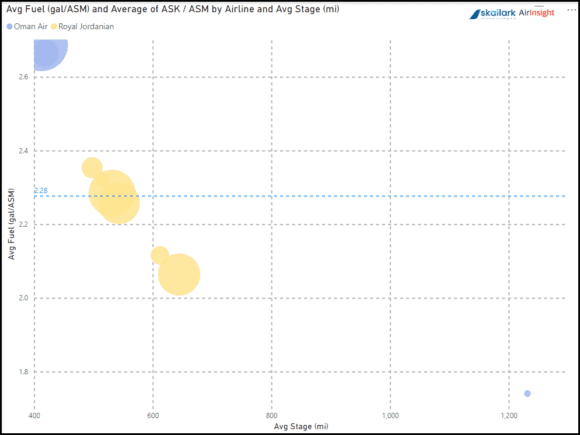
Middle East
North America
Oceania
Summary

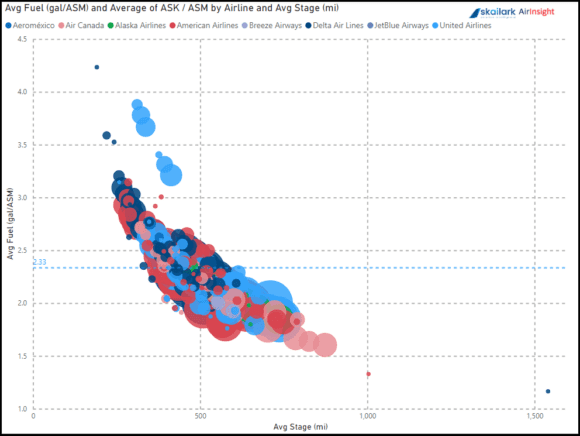
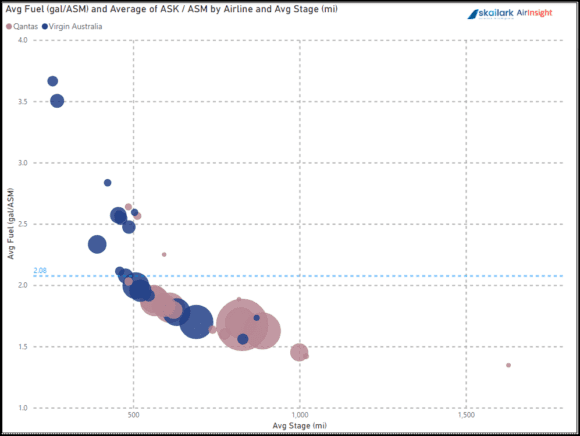
- Regional flying is typically under 500 miles, but the charts show stage lengths can vary.
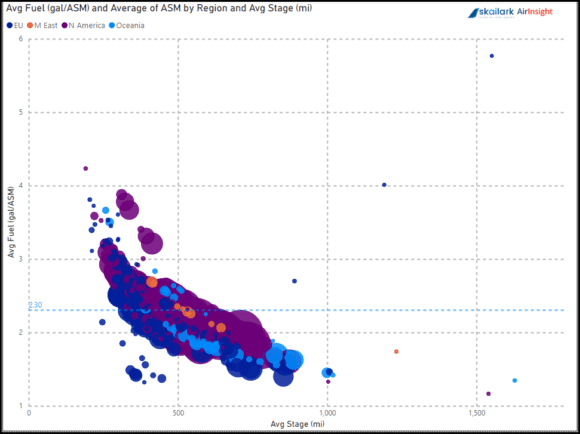
- Fuel burn per ASM is equally consistent, and fuel burn varies with stage lengths.
- Flight ops impact is ~four times larger than ASM impact.
- The following chart shows how, despite outliers, markets have good symmetry.
Regional flying is challenging because it is fuel-burn intensive and is typically attached to a more extended trip. This means airfare pricing is influenced by another airline rather than the regional operator. As we saw during the pandemic, regional flying has to step in when larger aircraft are inefficient.
Therefore, an appropriate question might be: As airlines continue to upsize to >180 seats from around 160 in the single-aisle segment, where does this leave regional operators? And since ~80% of regional traffic is North American based, how long can the Scope Clause remain sacrosanct?
Something will have to give to make the market work and remain efficient.
Views: 1

