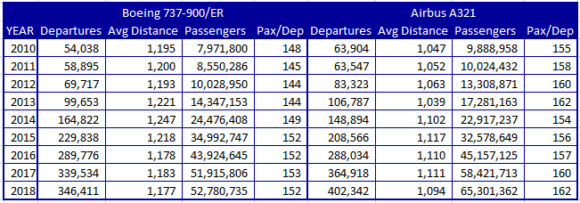
The MoM is hotly contested territory already. Airbus appears to be winning in this segment with the A321. What data can we use to demonstrate just how tight the competition is? After all, it’s more than just orders – the real metric has to be aircraft utilization. Using the US DoT T-100 data we found the following.
This chart has the years along the X-axis – note the 2018 data is not for the full year but is equal for both aircraft. The Y-axis is the number of departures. The ball is sized by the number of passengers.
The chart shows that Boeing’s 737-900 (data combined for the -900 and -900ER) is falling behind, at least in the United States. The number of passengers flown looks roughly equal, but in fact, the Airbus is ahead as the table illustrates.
The data shows airlines are using the aircraft on equivalent routes. The A321 is routinely carrying better loads though.
While the numbers are close between the Airbus and Boeing models currently in US service, when one combines the orders it is clear the 737 is not as competitive. It is still an open question as to whether the MAX models (9&10) will make any difference in the market. These two models have a big, and growing gap, to close.
Views: 1


