2019 09 16 8 09 02
This morning we woke to an overnight oil price spike. While politicians politic and primp for the cameras, the rest of us will try to figure out what this means and what might happen next. Here’s some data to help with the process of figuring out the impact of the oil price spike on airlines.
Our data is based on the US DoT Form 41, and while the data presented is US-centric, it does provide for useful benchmarks for airlines and aircraft outside the US.
The first table provides data points on the cost of fuel per flight hour, among the biggest US airlines.
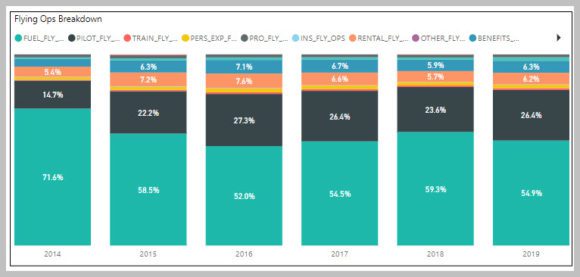
To provide perspective on the numbers above, next, we have flying costs broken down into the key components. Fuel costs in 2019 through March is still well over 50%. Fuel remains the most expensive input for the airline industry.
In another view on the impact of fuel costs, this next table lists fuel cost per seat/hour by aircraft type in service. Please click on the table to expand it for easier viewing.
Airlines with the latest generation aircraft benefit most from lower fuel burn. This does not help, though, if your latest models are not flying. The MAX has superb fuel burn numbers, but American, Southwest, and United cannot benefit at present. On the other hand, the A320neo family operators are benefiting from superb fuel burn numbers. Comparing the widebodies, the 787s have excellent fuel burn numbers (compared to 767 and A330). The A350-900 fuel burn is better than that of the 777-200 or 777-300ER and compares well with that of the 787-9.
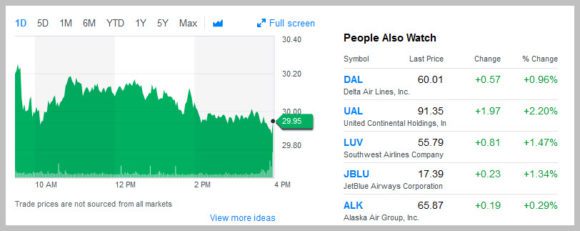
The market reaction to the latest oil shock seems muted – the US oil reserves are available. The market is not short of oil. The chart below shows stock prices for American Airlines and its main industry competitors. All are in the green this morning.
The latest spike is not worrying the market. But it is useful to know what airline fleets look like in terms of fuel burn.
Views: 4


