2024 08 26 14 19 57
There’s been some chatter about whether the US is about to see a pullback on the number of flights. Does the data support this?
This chart lists the number of flights by US airlines since the pandemic. The curves show a strong recovery among the big four.

While future schedules might be trimmed, the industry has shown resilience. American Airlines emerged from the pandemic and offered more flights than its peers among the big four. It has maintained that profile since. Southwest accelerated fastest post-pandemic, then fell back in 2021 and again accelerated in mid-2022. Among the big four, United has consistently operated the fewest number of flights. Delta, Southwest, and United follow each other closely.
If we look at the big picture, flight frequencies have grown each year since the pandemic.

We see the consistencies in the flight frequencies on a seven-day moving average.

After evaluating flight frequencies with traffic, we get the following chart.

Notice how airlines were caught off guard by the decline, but possibly based on their experience with SARS and other exogenous disruptions, they kept flying. No doubt PPP helped with this decision. But historically, traffic always comes back. Even though it did, giving us a V-ish traffic recovery, the gap between flights and passengers is wider now than in 2019.
So, if there is a concern with “too much capacity”, one needs to see how well airlines have controlled their capacity. The following chart reports data through 1Q24 from the T2.

The chart shows that the industry has managed load factors very well. The average load factor has been around 80% since 2006. Next, notice how aircraft capacity has risen. In 2000, the average seating was ~140 per flight; in 1Q24, it was 168. A 20% increase in capacity and load factors remained broadly consistent. That is an impressive performance.
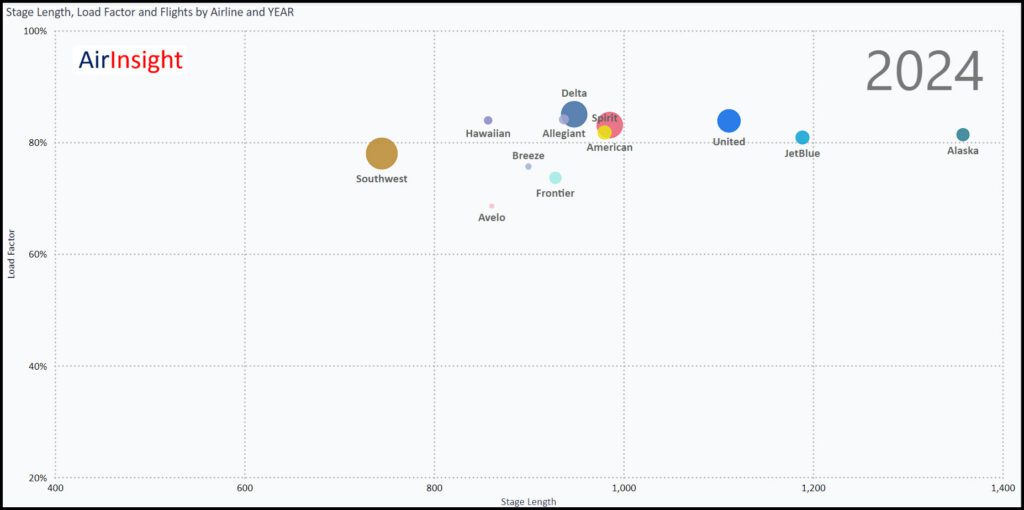
If US airlines are cutting back schedules, then something must be signaling significantly softer forward bookings. At this stage, the industry still looks robust. The size of each ball reflects the number of flights.

The relative sizes and stage lengths offer a good view of how these airlines compare. If the big airlines do cut back, the smaller operators will almost certainly garb at new opportunities.
Views: 29


