Grounded Aircraft
AirInsight has created a new metric for use during the COVID-19 pandemic to illustrate the depth of the impact on the industry and the recovery. We utilize a combination of passenger traffic compared to a 2019 baseline, the number of flights compared to that same baseline, and average passenger load compared to a 2019 baseline. Our composite comparison, with 2019 equal to 100, provides us with a general picture of industry health. We are typically a couple of days behind in the availability of data and update our index daily.
The traffic metric provides an indication of how quickly traffic is rebounding. The number of flights metric is indicative of airline operations and costs. The load metric measures how well the airlines are adapting their schedules to market requirements. Our composite provides a surrogate measure for industry health.
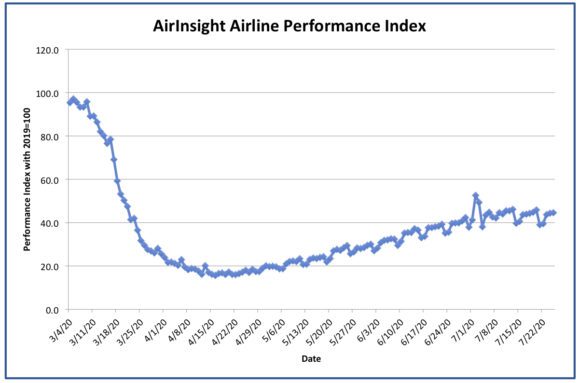
The following graphic shows the impact of the pandemic on US airlines from March 4th, 2020 until the present using the AirInsight Airline Performance Index:

After a slight run-up in mid-July, our index has fallen back again in late July. Our eight most recent data points are shown in the table below:
| DATE | PERFORMANCE INDEX |
| 18 July | 44.3 |
| 19 July | 44.8 |
| 20 July | 45.8 |
| 21 July | 38.9 |
| 22 July | 39.6 |
| 23 July | 43.7 |
| 24 July | 44,3 |
| 25 July | 44.6 |
The most recent data indicate a setback for air travel in late July, and carriers have been adjusting their schedules in August to reduce capacity to better match expected demand. Several carriers have replaced some non-stop flights with one-stop flights, serving two destinations with one aircraft in an attempt to increase load factors.
We will update the AirInsight Performance Index as soon as data become available for each day, and will publish that index in our Morning Call report each day along with our tracking chart. Please check our Morning Call for daily news stories of interest, as well as our performance index.
Breaking down our index into component parts illustrates key elements of how the industry is performing year over year, using 2019 as our baseline. As well as being the latest year without COVID-19, it was also a profitable year for the industry, both airlines, and the entire aircraft supply chain.
Our first component is traffic. This element took a nosedive earlier this year, reaching a nadir of 4% of last year’s traffic. With traffic still under 30% of last year, there remains a long way to go. A spike in early July over the fourth of July weekend that fueled some optimism and resumption of some flights for August fell back down, with airlines canceling some of the resumptions of those scheduled operations. Traffic is recovering slowly, as fear of COVID-19 is a key factor in the marketplace.

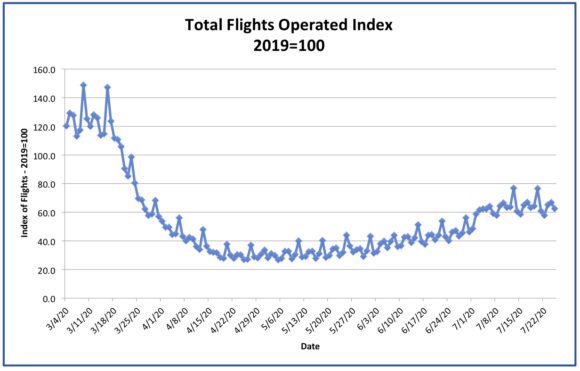
Our second component is the number of operating flights. This is indicative of industry activity and the actions being taken by airlines to adjust to the new market conditions. At the beginning of the year, airlines were actually operating more flights than in 2019, but that quickly changed in March when the pandemic hit the US, and lockdown orders essentially halted travel. Airlines dramatically cut back schedules as traffic plummeted to low levels. Flights have increased in recent months, but appear to be falling back as traffic growth has stalled. With airlines cutting back on their capacity for August, we expect this index to drop slightly in the near future.

Our third component is average load, an indication of what it will take to return to profitable circumstances for the industry. To date, average loads have been well below prior levels. While April and May showed promise as airlines tried to match capacity with traffic, it is clear that airlines have not yet been able to generate the traffic necessary to raise the average number of passengers per flight much above 40 people on average. After positive trends in June and early July, traffic fell once again as new states began to see higher numbers of infections reported in the media. While risks of death or serious illness remain quite low, the fear factor among airline passengers remains quite high and is likely to do so for some time.

Our combined index indicates that the industry is recovering quite slowly, but with capacity adjusting downward to meet demand, airlines are in a slightly better position than earlier in the year. But we are far from being out of the woods, as the recovery appears to be a very long Nike swoosh-like shape and airlines are clearly operating with massive losses.
The AirInsight Airline Performance Index stands at 44.6 on July 25th. The industry needs it to be at 100 or more to resume its normal growth path. That is, unfortunately, not likely to happen soon.
Views: 0


