The use of DoT Form 41 data is something many analysts argue over. Is the data reliable? (Sometimes) Do the airlines report the data honestly? (We hope) Is there reason to doubt the numbers (More often than anyone likes). Even with these caveats, Airbus and Boeing will use the data to make a point that supports their position in a campaign. Even with the questions about the data, it remains the most detailed source of airline and aircraft operational data anywhere.
So, as we often do, we go into the data and see what the latest numbers tell us. We decided to examine how the two most popular aircraft in the industry compare over the last five years?
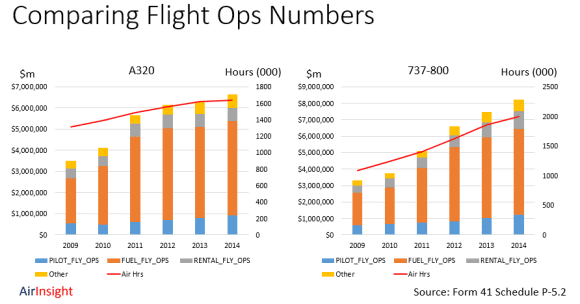
In the first chart we show data from the Form 41 Schedule 5.2 comparing operational costs and flight hours. Within the United States even though the A320 was flying before the 737-800, the Boeing soon eclipsed it in terms of flight hours per year, as more US carriers operate the Boeing. As we can see in the case of both aircraft, from operations, fuel costs are by far the largest input cost.
If we take the data above and put it into a table with percentages, the output looks like this. As the data show, the numbers are exceptionally close.
 And when we examine total operations costs per hour for the period we find the following results. Again we can see the numbers are close and it looks like the A320 is a bit cheaper to operate. Averaging the numbers for the period, the A320 costs 96.7% of the cost of the 737-800. So again it is very close.
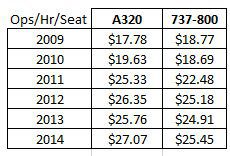
Finally to get the numbers as even as possible we reduced the cost to a per seat basis and generated the following table. We have assumed that the A320 has 150 seats and the 737-800 has 162. Once again we can see how close the numbers are. However, on a per-seat basis, the A320 is on average 4.5% more expensive to operate. Boeing will no doubt agree with these numbers and Airbus will dispute them because, after all, one cannot trust Form 41 data.
Views: 10


Well done , very nice study. Base on above, I wonder why A320 orders are far more than B737-800.
Two possible answers could be a) take-off performance, where the A320 can take off with a full load from a shorter runway and b) more importantly, purchase price. Also, maintenance and spare parts costs might be excluded from the operational cost graph; it’s hard to tell
I believe that the airlines report the data honestly, because there’s absolutely nothing to be gained by cheating, and it takes a lot of time and energy to cheat, which would be better spent on other things. That said, the accounting required to report these numbers is a bit complicated, and it’s fair to say there’s no consistency between airlines in how they allocate the costs and no requirement for them to report their accounting methodology. So if two similar airlines report radically different costs, it’s probably due to two different sets of good-faith accounting assumptions.
In turn, that means that trends within a single airline are probably valid, and trends for the industry as a whole are valid. But comparisons of the same data sets between different airlines are not valid.