Conversations with several industry thinkers point to a post-pandemic airline industry fleet deployment that is likely to focus on flexibility. Gone is the “horses-for-courses” thinking. If all you have is a hammer, everything is a nail. US airlines will focus on a fleet that can just about everything and misuse aircraft as necessary.
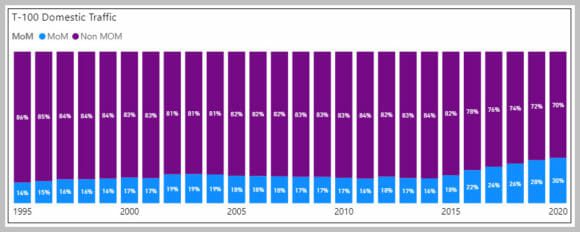
What does the data suggest we should look for? The problem here is that any data pre-Covid is of marginal use. But when that’s all you have; hammer meet nail. Looking at the US DoT T100 domestic data which is through January this year, we note the following: there has been a steady rise in the amount of traffic being flown on MoM-sized aircraft.
But that was way back when we were in a market that was somewhat logical. Now we have a market that has literally start from near-zero. As the first green shoots start to appear, how might US airlines try to serve this fragile air travel market? The attraction of MoM-sized aircraft is out the window. The number of flights that require over 180 seats has to be tiny. If not the MoM solution, then what?
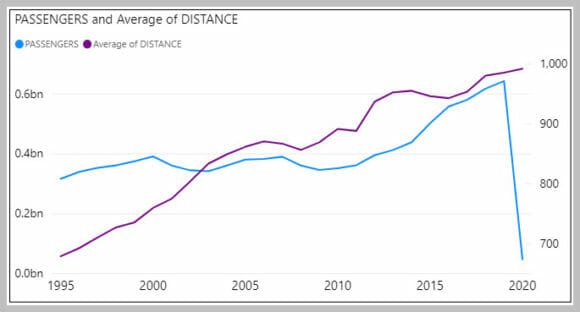
Even though we are now in “unchartered waters”, so to speak, the population of the US not disappeared. There are people who need to, indeed, want to travel. The following chart shows the average distance flown along with passenger volume. Please ignore the January 2020 volume (blue).
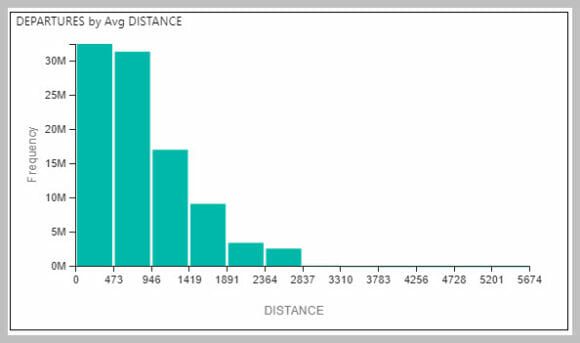
The key takeaway here is that flights average about 1,000-mile range. As the next distribution chart illustrates, more than half the US domestic flights are under 1,000 miles.
The data suggests that the optimal aircraft deployed in the market requires no more than 3,000-mile range. 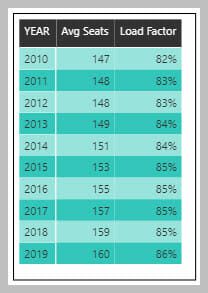 Indeed, the data suggests smaller is better than bigger. Focusing on the shorter ranges is more effective.
What about the most optimal gauge? Again we look back to understand the murky future. The table shows how robust the market has been by way of load factor even as the average seat count has grown. Even as airlines added seats, passenger travel demand grew.
But, once again, that was then.
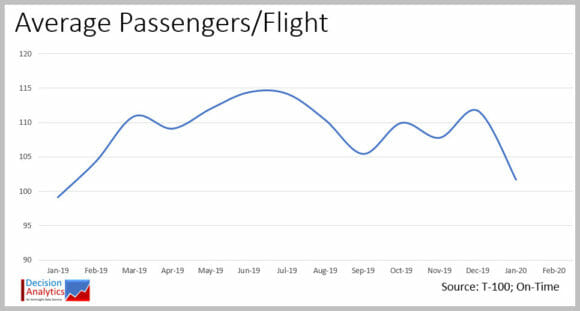
Making any fleet decision requires data to support such decisions. The US DoT data is too slow to offer any guidance. Airline managers know their loads and can optimize accordingly. Combining the data the T-100 and On-Time datasets we get an idea what the typical US domestic passengers load was through January 2020. The combination of these sources leads us to this chart.
The average US domestic flight flies under 1,000 miles and carries about 100 passengers.
Views: 2

