77455013 arrive on time clock punctual schedule 3d illustration
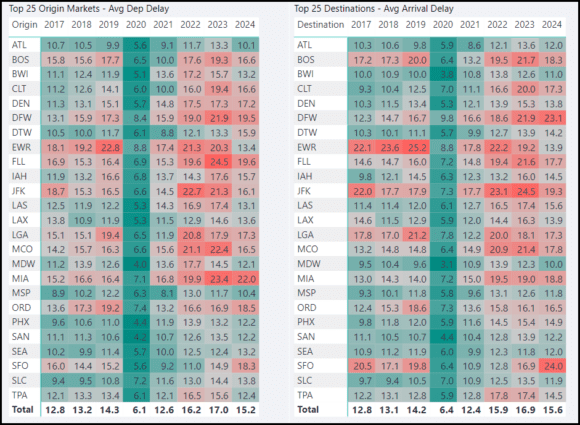
Flying in the US is back to the bad old days. Take a look at this table—the 2024 numbers are through February.

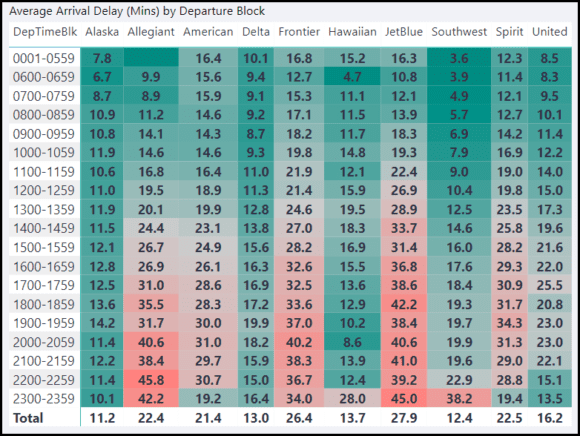
After the pandemic, arrivals are later than ever. Look at all that red! If we look at the numbers by airline rather than airport, here’s what we have.

Moreover, the delays are across the board-late departures are not fixed by making up time for arrivals. So much red!

And this is what it cost travelers in 2023 – not that travel’s “lost time” means anything to the carrier. The Contract of Carriage was written to protect the airline.
For perspective, in 2023, there were 64.6 million US air travelers. Multiply that~65 million people by an average of 16 minutes of arrival delays, and you get over 48,000 daily lost hours. What do you think that’s worth? There is a real GDP cost.
The DOT, Senate, and academia have estimated the cost to the US economy (GDP) at up to $80 billion in lost opportunity and productivity over several decades, excluding losses incurred by the airline industry. Wall Street needs to hold airlines’ feet to the fire.

This two-page model lists the top ten US airports (and major airlines) by traffic volume. The few green patches tell you what you might know from experience.
This wasted time problem can be fixed.
According to former airline executive and consultant Bob Mann, “From a queueing theory and practical perspective, airports (and ATC) are multi-server, fixed capacity service systems, whose capacity is periodically reached, occasionally exceeded, and degrades under certain conditions (winds and visibility, for example).
Again, from a queueing theory perspective, airlines create demands for service (enroute, terminal area, arrivals, departures), and the demand rates per time interval (discrete time, or X minute interval), which, despite ‘schedules’ which suggest deterministic, are essentially un-managed, and whose demand rates per time interval become randomized (highly variant) on day-of-flight, causing peaking.
Queueing theory dictates that as service systems near capacity, delays increase. Further, irrespective of the average demand rate, as the variance of demand rate (randomness) rises, delays begin sooner (at lower average demand rates) and become exponentially worse/greater.
So, to sum up, airlines’ failure to self-help, to manage their 4D day-of-flight flight trajectories and demand rates causes ATC (whose objectives are safety and separation, without regard for airline-centric objectives) to ‘warehouse’ excess variant demands during a time interval, which delays or pushes the queue backward in time.
Now, if airlines chose to, they could optimize or manage their own 4D day-of-flight flight trajectories, each according to its airline-centric business rules, pulling individual flights and the entire queue slightly forward in time. This works for managing airlines even when OAL flights are not managed, though OAL gets a slight benefit since the entire queue is pulled forward in time.
Alternatively, ATC could introduce this optimization approach as a service for airlines to adopt and broker the optimal airline-centric solutions. This approach has been proven to work nearly as well as individual carrier optimizations and far better than the existing, unmanaged approach that, despite billions of dollars and decades of effort, still generates delays.
But only if serious people use it.”
As the next table shows, if Wall Street held the airline industry to task, returns would improve. The upside of better operational performance is clear.

Then there’s that $80 billion cost from wasted time. Who’s going to fix that? Who can fix that? Getting airlines and airports to improve flight operations helps to solve the problem.
Views: 3


