iberia 4751092081442275
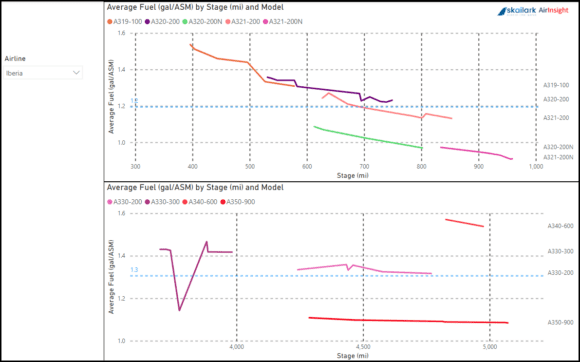
Using Skailark‘s data, we developed this model that shows an airline’s fleet fuel burn. We are using Iberia for this example.

The upper chart lists the single-aisle fleet, and the lower chart lists the twin-aisle fleet. The model offers a stage-adjusted range of fuel numbers (gal/ASM). The dashed blue horizontal line is the average.
Single-Aisle
- The chart shows a neat comparison between the Airbus CEO and NEO families.
- The averages show what we’ve seen in this dataset and the US DoT datasets—the NEO is about 20% better than the previous generation. By the way, this is also the result we’ve seen for the MAX to NG.
- Notice also that because the NEO has the better fuel burn, Iberia stretches its stage lengths to exploit this. Fuel efficiency improvements allow the airline to fly further with the same payload.
Twin-Aisle
- Once again, we see the generational improvement.
- It is clear why the A340-600 had a rather short commercial life – so much for “4 engines for long-haul.”
- The A350-900 is proving to be a compelling improvement for Iberia’s long-haul flights.
Summary
- The model illustrates why airlines chase new deliveries as fuel prices rise again.
- State-of-the-art aircraft are being pushed harder. The other side of this issue is breaking engines.
- As always, every advantage comes with tradeoffs.
- This remains one of the most fascinating industries, continually testing technologies, people, and strategies.
Views: 5


