skai3
If environmental performance is to become an essential element of commercial aviation’s future, airlines need to change the way they plan their operations and fleets. Many airlines choose an aircraft type based on the longest haul route they have, then deploy this aircraft type on shorter routes. Fleet commonality and scale economics are typically the reason for selecting an aircraft, while actual cost and benefit calculations versus complexity are not always considered. But is it optimal, from an environmental perspective, to utilize an aircraft with an 8,000 nautical mile range on a trans-Atlantic route of half of that distance? Are there “horses for courses?”
Is it better to have several fleet types optimized for a different range? Would a fleet of A321neos, operating near their maximum range, be more efficient than a widebody with much longer capabilities on the same route? Are they holistically seen, including the much larger feed requirement for the larger widebody? To evaluate this thesis, we examine data from skailark’s environmental dashboard regarding environmental efficiency.
Long-range aircraft carry and burn more fuel than shorter-range aircraft. Aircraft built for ultra-long ranges have a heavier structure to accommodate the additional weight of fuel they can carry. The result is that even if the tanks are only half full for a shorter-range flight, that additional structural weight still needs to be airborne. In aviation, every pound saved translates into lower fuel burn, as that pound doesn’t need to be lifted into the air, which requires fuel, thereby generating carbon emissions. A side effect of less “contingency fuel” carried is reduced weight and emissions. The higher the payload to overall weight ratio of the aircraft, the better its environmental performance should be, assuming other things, such as engine efficiency, advanced materials, and aerodynamics, remain similar.
Let’s look at the environmental performance and contrast aircraft on the LON-NYC routes, including LHR, LGW, JFK, and EWR. The following chart lists the aircraft utilized on this roughly 3,000-nautical mile route. The Y-axis shows carbon emissions (pounds) per available seat, and the X-axis lists carbon emissions (in pounds) per flight. The dashed lines represent averages for each axis. The ball size reflects the number of flights by aircraft type fr January 1st, 2021, through December 31st, 2022, the period over which data have been averaged.
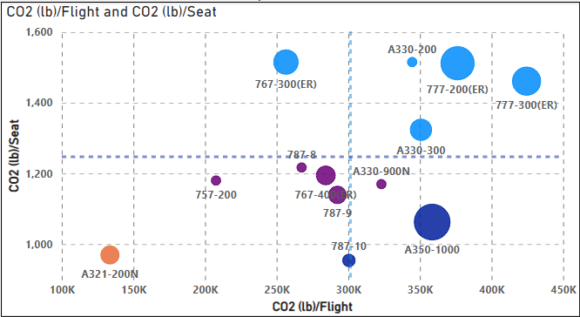
The chart shows the aircraft models clustered by color. At the top right are the aircraft in light blue with similar ranking. The purple group and dark blue are also clusters of approximately equal performance. The orange aircraft is in a cluster by itself.
The ideal core location for this chart would be at zero.zero, in the lower left corner. The second-best location would be below and to the left of the dashed lines. The third best location, in our view, is below the dashed line for carbon/seat. As one would expect, the newer aircraft perform better than older models. The results for the 757, A330neo and 787 reflect fewer than five flights using those models, a very small sample size during the time frame that would lead us to discount those results.
This brings us to a potential new aircraft efficiency statistic – payload (passenger and cargo) to the aircraft’s overall weight. Let’s look at this metric and compare it against directly measured carbon consumption per seat to see if it could be helpful for fleet planners in evaluating the potential carbon performance of aircraft on specific routes.
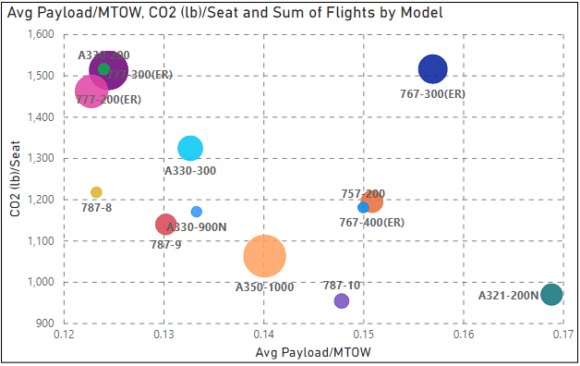
The A321 is again in a class by itself in this market, with a payload of 17% of overall weight. While this might sound slight, remember the airplane’s fuselage, wings, and structure, and the fuel needed to go from point A to point B, subtracted from the maximum take-off weight, leaves the available payload for passengers and cargo. The aircraft on the LON-NYC route ranged between 12% and 17%. A small change in that metric significantly influences environmental performance.
On the chart above, the best location is as far out on the X-axis as possible and on the Y-axis as low as possible. This reflects the A321 carrying relatively low “extra” structural weight and effectively serving this 3,000 nautical mile segment. The 767 models, with a shorter range than competitors, also rank well on this scale but lack modern engines and produce higher carbon content. Similarly, the 787-10, which incorporates a larger fuselage and additional payload, trades range for capacity compared to smaller 787 models and fares well in emissions per seat.
The 787-10 has sufficient range for most routes (not 15+ hours) and is not yet enjoying the 787-9 market success. Part of this may be either in the airlines’ desire for flexibility or in discounting yields on larger aircraft – thus, we will not dwell entirely on it here. However, knowing that fuel is the highest cost item and directly links to CO2 emissions, the most environmentally friendly solution should meet CFO approval.
The skailark database is robust, and the following chart looks at how the airlines operating on the route appear relative to each other. This chart results from aggregating data on a flight number by flight number basis each day during the relevant period to generate summary results.
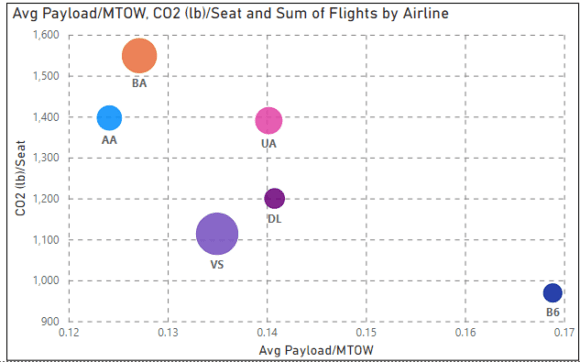
The results reflect the average fleet age and are no surprise after seeing the earlier charts. JetBlue’s A321 service is optimal for US East Coast to Europe routes and provides a clear advantage in carbon performance over other carriers.
This statistic may become more valuable as electrification occurs over the longer term and batteries are used on aircraft. Batteries don’t burn away, as does fuel, and that fixed weight must be lifted along with the payload. We measure battery output today in terms of kWh/kg. That ratio will likely grow threefold over the next decade if the laboratory results for solid-state batteries can be replicated in full-scale production. Today’s batteries for electric cars average between 200-250 kWh/kg. Companies like Lyten have solid-state batteries under development that expect to reach 900 KWH/kg and could enter service by 2030. But those batteries will still be heavy for us in aircraft.
The most significant percentage of fuel is consumed by aircraft over 150 seats flying over 1,500 miles; batteries are unlikely to impact the aviation carbon footprint before 2050. Current developments must focus on decarbonizing inefficient road transport and incremental aerial activities.
The Bottom Line
We can readily measure fuel burn and carbon output by aircraft type and, in analyzing the data understand why a fleet of different aircraft types optimized for the range flown brings significant environmental performance improvements for an airline. An A321 trans-Atlantic, with a 787-10 trans-Pacific, or Europe to the North American west coast, and A350 on ultra-long routes appear to be an ideal combination to optimize environmental performance over a varied route network. Provided the flight is filled with sufficient passengers, the layout does not waste too much space and reduces carbon efficiency. But is super long haul the way to go, or would – bearing all the above in mind – a limit to, say, 5,000nm be the optimal way from a carbon emission perspective leading straight to A321, A330NEO, 787-10?
To quote Nico Buchholz, industry consultant and former EVP of fleet planning at Lufthansa German Airlines Group, “a holistic approach on true demand patterns and profitability analysis reveals why there could be true horses for courses looking different from today.” To maximize environmental performance, we couldn’t agree more.
Views: 7


